Immigrants from Africa vs Immigrants from Switzerland Disability Age Over 75
COMPARE
Immigrants from Africa
Immigrants from Switzerland
Disability Age Over 75
Disability Age Over 75 Comparison
Immigrants from Africa
Immigrants from Switzerland
47.3%
DISABILITY AGE OVER 75
53.6/ 100
METRIC RATING
171st/ 347
METRIC RANK
45.3%
DISABILITY AGE OVER 75
99.9/ 100
METRIC RATING
23rd/ 347
METRIC RANK
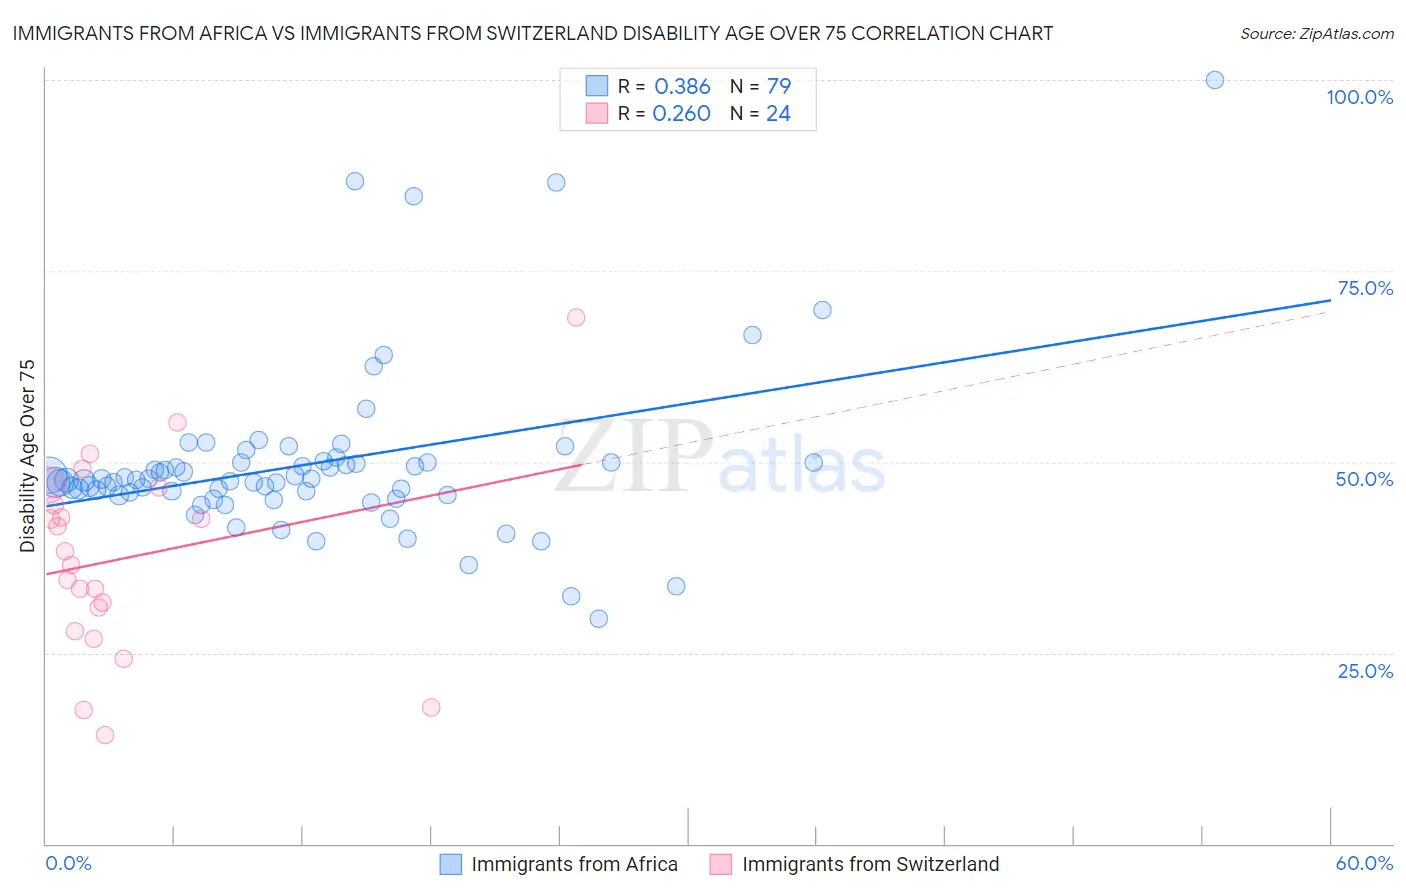
Immigrants from Africa vs Immigrants from Switzerland Disability Age Over 75 Correlation Chart
The statistical analysis conducted on geographies consisting of 468,103,212 people shows a mild positive correlation between the proportion of Immigrants from Africa and percentage of population with a disability over the age of 75 in the United States with a correlation coefficient (R) of 0.386 and weighted average of 47.3%. Similarly, the statistical analysis conducted on geographies consisting of 148,038,506 people shows a weak positive correlation between the proportion of Immigrants from Switzerland and percentage of population with a disability over the age of 75 in the United States with a correlation coefficient (R) of 0.260 and weighted average of 45.3%, a difference of 4.3%.
Disability Age Over 75 Correlation Summary
| Measurement | Immigrants from Africa | Immigrants from Switzerland |
| Minimum | 29.5% | 14.3% |
| Maximum | 100.0% | 69.0% |
| Range | 70.5% | 54.7% |
| Mean | 49.7% | 37.5% |
| Median | 47.6% | 37.5% |
| Interquartile 25% (IQ1) | 45.6% | 29.4% |
| Interquartile 75% (IQ3) | 50.0% | 45.5% |
| Interquartile Range (IQR) | 4.4% | 16.1% |
| Standard Deviation (Sample) | 11.2% | 12.8% |
| Standard Deviation (Population) | 11.1% | 12.5% |
Similar Demographics by Disability Age Over 75
Demographics Similar to Immigrants from Africa by Disability Age Over 75
In terms of disability age over 75, the demographic groups most similar to Immigrants from Africa are Scotch-Irish (47.3%, a difference of 0.030%), Alsatian (47.3%, a difference of 0.040%), German Russian (47.3%, a difference of 0.060%), White/Caucasian (47.3%, a difference of 0.080%), and Immigrants from Haiti (47.3%, a difference of 0.090%).
| Demographics | Rating | Rank | Disability Age Over 75 |
| French | 64.6 /100 | #164 | Good 47.2% |
| Immigrants | Zimbabwe | 64.4 /100 | #165 | Good 47.2% |
| Immigrants | Sierra Leone | 64.4 /100 | #166 | Good 47.2% |
| Moroccans | 62.9 /100 | #167 | Good 47.2% |
| Kenyans | 58.8 /100 | #168 | Average 47.2% |
| Celtics | 58.7 /100 | #169 | Average 47.2% |
| German Russians | 56.2 /100 | #170 | Average 47.3% |
| Immigrants | Africa | 53.6 /100 | #171 | Average 47.3% |
| Scotch-Irish | 52.5 /100 | #172 | Average 47.3% |
| Alsatians | 51.9 /100 | #173 | Average 47.3% |
| Whites/Caucasians | 50.0 /100 | #174 | Average 47.3% |
| Immigrants | Haiti | 49.7 /100 | #175 | Average 47.3% |
| Ecuadorians | 46.7 /100 | #176 | Average 47.4% |
| Haitians | 44.6 /100 | #177 | Average 47.4% |
| Cubans | 42.1 /100 | #178 | Average 47.4% |
Demographics Similar to Immigrants from Switzerland by Disability Age Over 75
In terms of disability age over 75, the demographic groups most similar to Immigrants from Switzerland are Polish (45.3%, a difference of 0.020%), Immigrants from South Africa (45.3%, a difference of 0.030%), Immigrants from Belgium (45.3%, a difference of 0.060%), Immigrants from Bolivia (45.4%, a difference of 0.070%), and Macedonian (45.4%, a difference of 0.10%).
| Demographics | Rating | Rank | Disability Age Over 75 |
| Immigrants | Northern Europe | 100.0 /100 | #16 | Exceptional 45.2% |
| Immigrants | India | 100.0 /100 | #17 | Exceptional 45.2% |
| Bolivians | 100.0 /100 | #18 | Exceptional 45.2% |
| Immigrants | Greece | 100.0 /100 | #19 | Exceptional 45.2% |
| Immigrants | Serbia | 100.0 /100 | #20 | Exceptional 45.3% |
| Immigrants | Belgium | 100.0 /100 | #21 | Exceptional 45.3% |
| Immigrants | South Africa | 100.0 /100 | #22 | Exceptional 45.3% |
| Immigrants | Switzerland | 99.9 /100 | #23 | Exceptional 45.3% |
| Poles | 99.9 /100 | #24 | Exceptional 45.3% |
| Immigrants | Bolivia | 99.9 /100 | #25 | Exceptional 45.4% |
| Macedonians | 99.9 /100 | #26 | Exceptional 45.4% |
| Immigrants | Poland | 99.9 /100 | #27 | Exceptional 45.4% |
| Thais | 99.9 /100 | #28 | Exceptional 45.4% |
| Filipinos | 99.9 /100 | #29 | Exceptional 45.4% |
| Immigrants | Denmark | 99.9 /100 | #30 | Exceptional 45.4% |