Russian vs Immigrants from Switzerland Disability Age Over 75
COMPARE
Russian
Immigrants from Switzerland
Disability Age Over 75
Disability Age Over 75 Comparison
Russians
Immigrants from Switzerland
45.5%
DISABILITY AGE OVER 75
99.9/ 100
METRIC RATING
34th/ 347
METRIC RANK
45.3%
DISABILITY AGE OVER 75
99.9/ 100
METRIC RATING
23rd/ 347
METRIC RANK
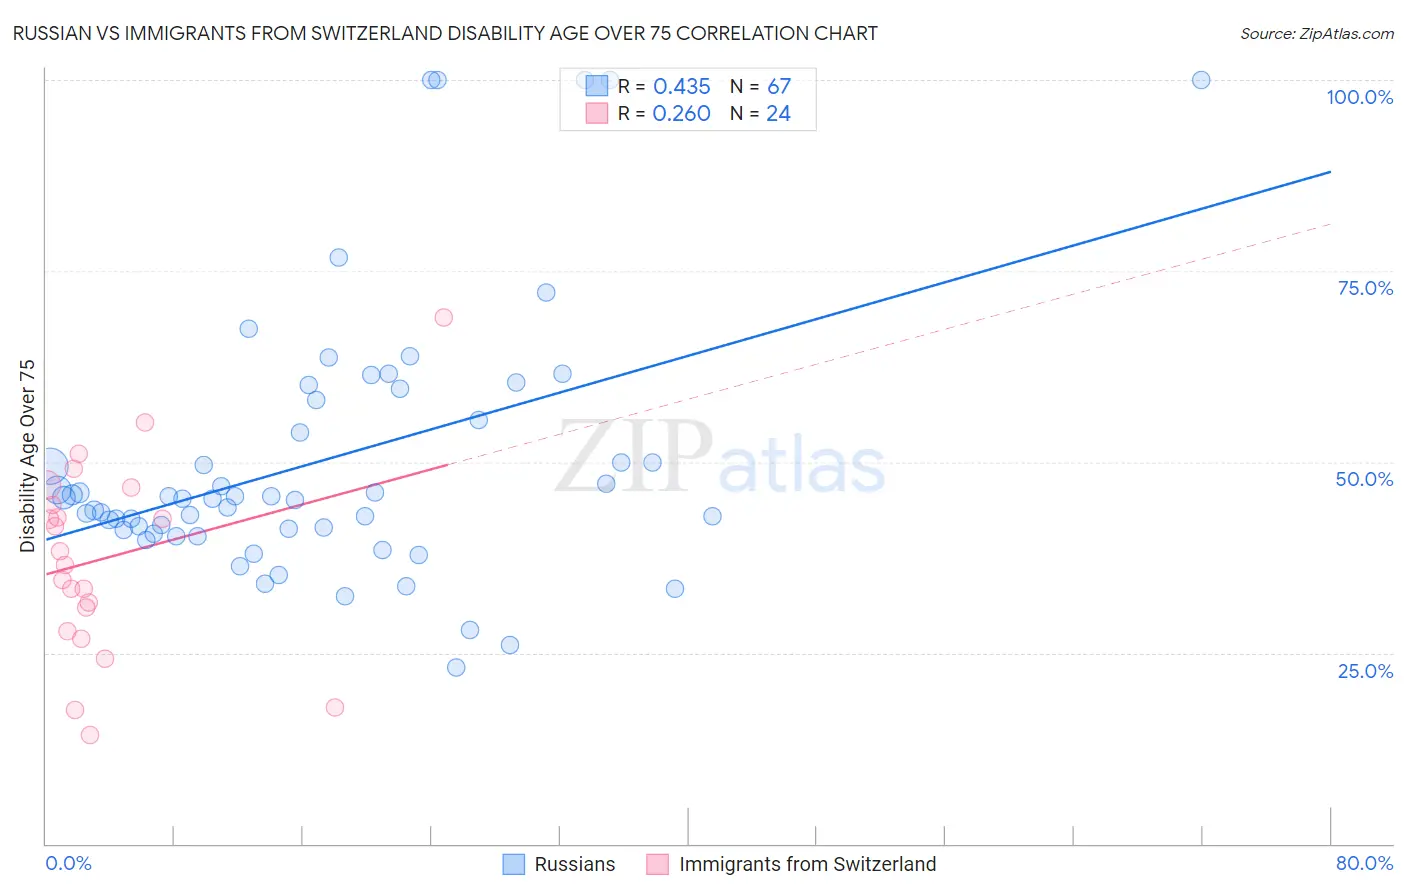
Russian vs Immigrants from Switzerland Disability Age Over 75 Correlation Chart
The statistical analysis conducted on geographies consisting of 510,763,509 people shows a moderate positive correlation between the proportion of Russians and percentage of population with a disability over the age of 75 in the United States with a correlation coefficient (R) of 0.435 and weighted average of 45.5%. Similarly, the statistical analysis conducted on geographies consisting of 148,038,506 people shows a weak positive correlation between the proportion of Immigrants from Switzerland and percentage of population with a disability over the age of 75 in the United States with a correlation coefficient (R) of 0.260 and weighted average of 45.3%, a difference of 0.40%.
Disability Age Over 75 Correlation Summary
| Measurement | Russian | Immigrants from Switzerland |
| Minimum | 23.1% | 14.3% |
| Maximum | 100.0% | 69.0% |
| Range | 76.9% | 54.7% |
| Mean | 50.2% | 37.5% |
| Median | 45.2% | 37.5% |
| Interquartile 25% (IQ1) | 41.1% | 29.4% |
| Interquartile 75% (IQ3) | 58.1% | 45.5% |
| Interquartile Range (IQR) | 17.0% | 16.1% |
| Standard Deviation (Sample) | 17.6% | 12.8% |
| Standard Deviation (Population) | 17.4% | 12.5% |
Demographics Similar to Russians and Immigrants from Switzerland by Disability Age Over 75
In terms of disability age over 75, the demographic groups most similar to Russians are Norwegian (45.5%, a difference of 0.010%), Immigrants from Croatia (45.5%, a difference of 0.030%), Immigrants from Taiwan (45.5%, a difference of 0.040%), South African (45.5%, a difference of 0.040%), and Italian (45.6%, a difference of 0.090%). Similarly, the demographic groups most similar to Immigrants from Switzerland are Polish (45.3%, a difference of 0.020%), Immigrants from South Africa (45.3%, a difference of 0.030%), Immigrants from Belgium (45.3%, a difference of 0.060%), Immigrants from Bolivia (45.4%, a difference of 0.070%), and Macedonian (45.4%, a difference of 0.10%).
| Demographics | Rating | Rank | Disability Age Over 75 |
| Bolivians | 100.0 /100 | #18 | Exceptional 45.2% |
| Immigrants | Greece | 100.0 /100 | #19 | Exceptional 45.2% |
| Immigrants | Serbia | 100.0 /100 | #20 | Exceptional 45.3% |
| Immigrants | Belgium | 100.0 /100 | #21 | Exceptional 45.3% |
| Immigrants | South Africa | 100.0 /100 | #22 | Exceptional 45.3% |
| Immigrants | Switzerland | 99.9 /100 | #23 | Exceptional 45.3% |
| Poles | 99.9 /100 | #24 | Exceptional 45.3% |
| Immigrants | Bolivia | 99.9 /100 | #25 | Exceptional 45.4% |
| Macedonians | 99.9 /100 | #26 | Exceptional 45.4% |
| Immigrants | Poland | 99.9 /100 | #27 | Exceptional 45.4% |
| Thais | 99.9 /100 | #28 | Exceptional 45.4% |
| Filipinos | 99.9 /100 | #29 | Exceptional 45.4% |
| Immigrants | Denmark | 99.9 /100 | #30 | Exceptional 45.4% |
| Immigrants | Bulgaria | 99.9 /100 | #31 | Exceptional 45.5% |
| Immigrants | Australia | 99.9 /100 | #32 | Exceptional 45.5% |
| Immigrants | Croatia | 99.9 /100 | #33 | Exceptional 45.5% |
| Russians | 99.9 /100 | #34 | Exceptional 45.5% |
| Norwegians | 99.9 /100 | #35 | Exceptional 45.5% |
| Immigrants | Taiwan | 99.9 /100 | #36 | Exceptional 45.5% |
| South Africans | 99.9 /100 | #37 | Exceptional 45.5% |
| Italians | 99.9 /100 | #38 | Exceptional 45.6% |