Immigrants from Africa vs Immigrants from North America Single Father Poverty
COMPARE
Immigrants from Africa
Immigrants from North America
Single Father Poverty
Single Father Poverty Comparison
Immigrants from Africa
Immigrants from North America
15.8%
SINGLE FATHER POVERTY
95.1/ 100
METRIC RATING
110th/ 347
METRIC RANK
16.6%
SINGLE FATHER POVERTY
15.1/ 100
METRIC RATING
203rd/ 347
METRIC RANK
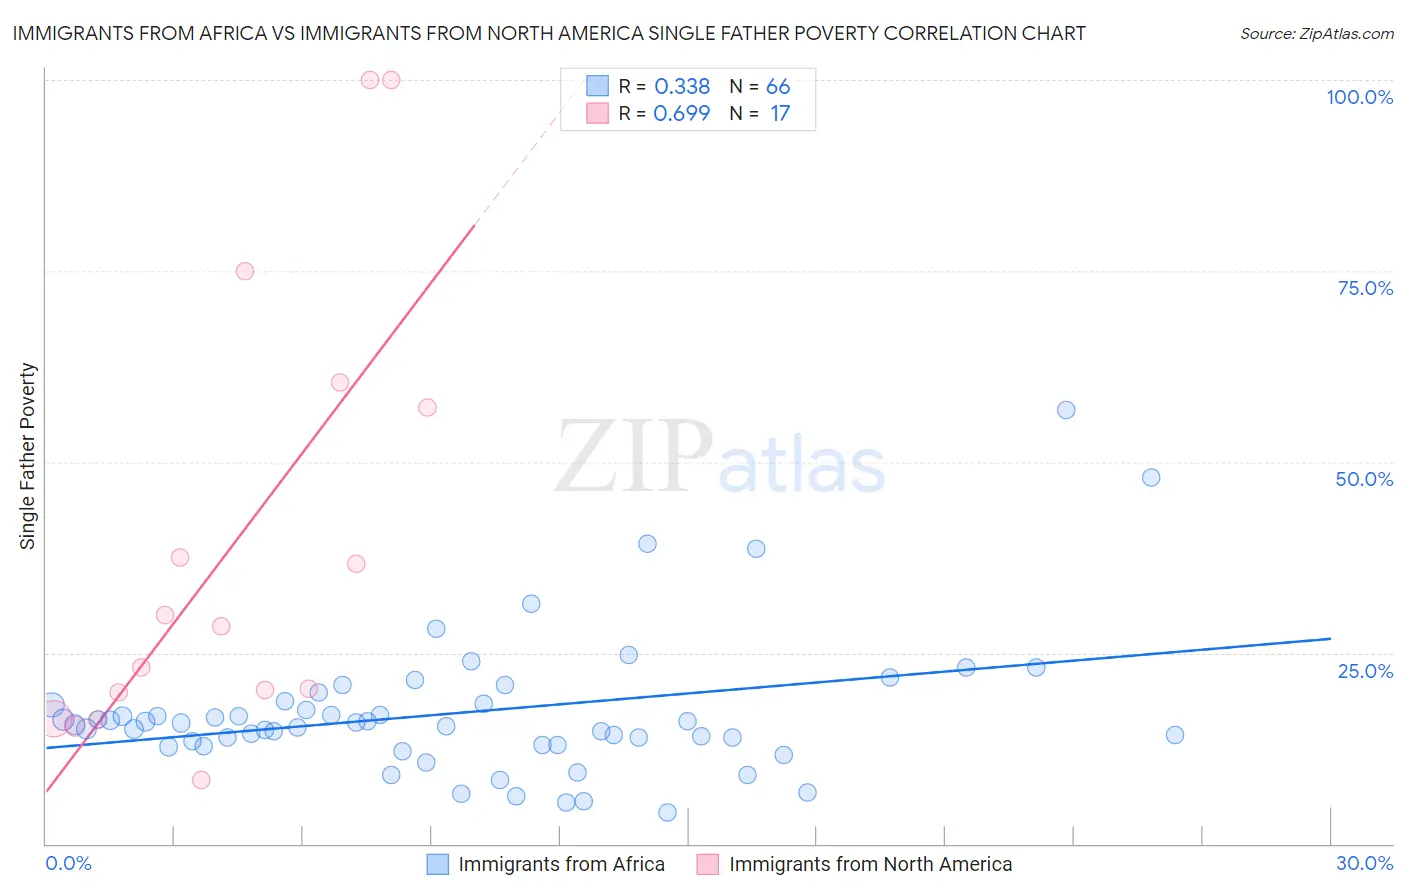
Immigrants from Africa vs Immigrants from North America Single Father Poverty Correlation Chart
The statistical analysis conducted on geographies consisting of 360,154,757 people shows a mild positive correlation between the proportion of Immigrants from Africa and poverty level among single fathers in the United States with a correlation coefficient (R) of 0.338 and weighted average of 15.8%. Similarly, the statistical analysis conducted on geographies consisting of 349,960,256 people shows a significant positive correlation between the proportion of Immigrants from North America and poverty level among single fathers in the United States with a correlation coefficient (R) of 0.699 and weighted average of 16.6%, a difference of 5.3%.
Single Father Poverty Correlation Summary
| Measurement | Immigrants from Africa | Immigrants from North America |
| Minimum | 4.1% | 8.4% |
| Maximum | 56.8% | 100.0% |
| Range | 52.7% | 91.6% |
| Mean | 17.1% | 39.1% |
| Median | 15.7% | 28.5% |
| Interquartile 25% (IQ1) | 13.0% | 18.1% |
| Interquartile 75% (IQ3) | 18.3% | 58.8% |
| Interquartile Range (IQR) | 5.3% | 40.7% |
| Standard Deviation (Sample) | 9.1% | 29.1% |
| Standard Deviation (Population) | 9.0% | 28.3% |
Similar Demographics by Single Father Poverty
Demographics Similar to Immigrants from Africa by Single Father Poverty
In terms of single father poverty, the demographic groups most similar to Immigrants from Africa are Turkish (15.8%, a difference of 0.010%), Bulgarian (15.8%, a difference of 0.050%), Immigrants from Latvia (15.8%, a difference of 0.080%), Danish (15.8%, a difference of 0.13%), and Argentinean (15.8%, a difference of 0.14%).
| Demographics | Rating | Rank | Single Father Poverty |
| South American Indians | 96.2 /100 | #103 | Exceptional 15.7% |
| Australians | 96.1 /100 | #104 | Exceptional 15.7% |
| Immigrants | Australia | 96.1 /100 | #105 | Exceptional 15.7% |
| Immigrants | Poland | 95.8 /100 | #106 | Exceptional 15.7% |
| Native Hawaiians | 95.8 /100 | #107 | Exceptional 15.7% |
| Pakistanis | 95.7 /100 | #108 | Exceptional 15.7% |
| Turks | 95.1 /100 | #109 | Exceptional 15.8% |
| Immigrants | Africa | 95.1 /100 | #110 | Exceptional 15.8% |
| Bulgarians | 94.8 /100 | #111 | Exceptional 15.8% |
| Immigrants | Latvia | 94.7 /100 | #112 | Exceptional 15.8% |
| Danes | 94.5 /100 | #113 | Exceptional 15.8% |
| Argentineans | 94.4 /100 | #114 | Exceptional 15.8% |
| Immigrants | Thailand | 93.6 /100 | #115 | Exceptional 15.8% |
| Immigrants | Argentina | 92.8 /100 | #116 | Exceptional 15.8% |
| Immigrants | Colombia | 92.6 /100 | #117 | Exceptional 15.8% |
Demographics Similar to Immigrants from North America by Single Father Poverty
In terms of single father poverty, the demographic groups most similar to Immigrants from North America are Immigrants from Guatemala (16.6%, a difference of 0.030%), Venezuelan (16.6%, a difference of 0.070%), Immigrants from Croatia (16.6%, a difference of 0.11%), Cuban (16.6%, a difference of 0.12%), and Immigrants from Senegal (16.6%, a difference of 0.12%).
| Demographics | Rating | Rank | Single Father Poverty |
| Immigrants | Canada | 21.9 /100 | #196 | Fair 16.5% |
| Immigrants | Northern Europe | 20.3 /100 | #197 | Fair 16.5% |
| Romanians | 20.1 /100 | #198 | Fair 16.5% |
| Immigrants | Belize | 19.8 /100 | #199 | Poor 16.5% |
| Syrians | 17.4 /100 | #200 | Poor 16.6% |
| Cubans | 16.5 /100 | #201 | Poor 16.6% |
| Immigrants | Croatia | 16.5 /100 | #202 | Poor 16.6% |
| Immigrants | North America | 15.1 /100 | #203 | Poor 16.6% |
| Immigrants | Guatemala | 14.8 /100 | #204 | Poor 16.6% |
| Venezuelans | 14.3 /100 | #205 | Poor 16.6% |
| Immigrants | Senegal | 13.7 /100 | #206 | Poor 16.6% |
| New Zealanders | 13.7 /100 | #207 | Poor 16.6% |
| Eastern Europeans | 13.7 /100 | #208 | Poor 16.6% |
| Europeans | 13.2 /100 | #209 | Poor 16.6% |
| Guatemalans | 12.9 /100 | #210 | Poor 16.6% |