Houma vs Immigrants from St. Vincent and the Grenadines Disability Age 65 to 74
COMPARE
Houma
Immigrants from St. Vincent and the Grenadines
Disability Age 65 to 74
Disability Age 65 to 74 Comparison
Houma
Immigrants from St. Vincent and the Grenadines
32.3%
DISABILITY AGE 65 TO 74
0.0/ 100
METRIC RATING
337th/ 347
METRIC RANK
23.7%
DISABILITY AGE 65 TO 74
26.1/ 100
METRIC RATING
195th/ 347
METRIC RANK
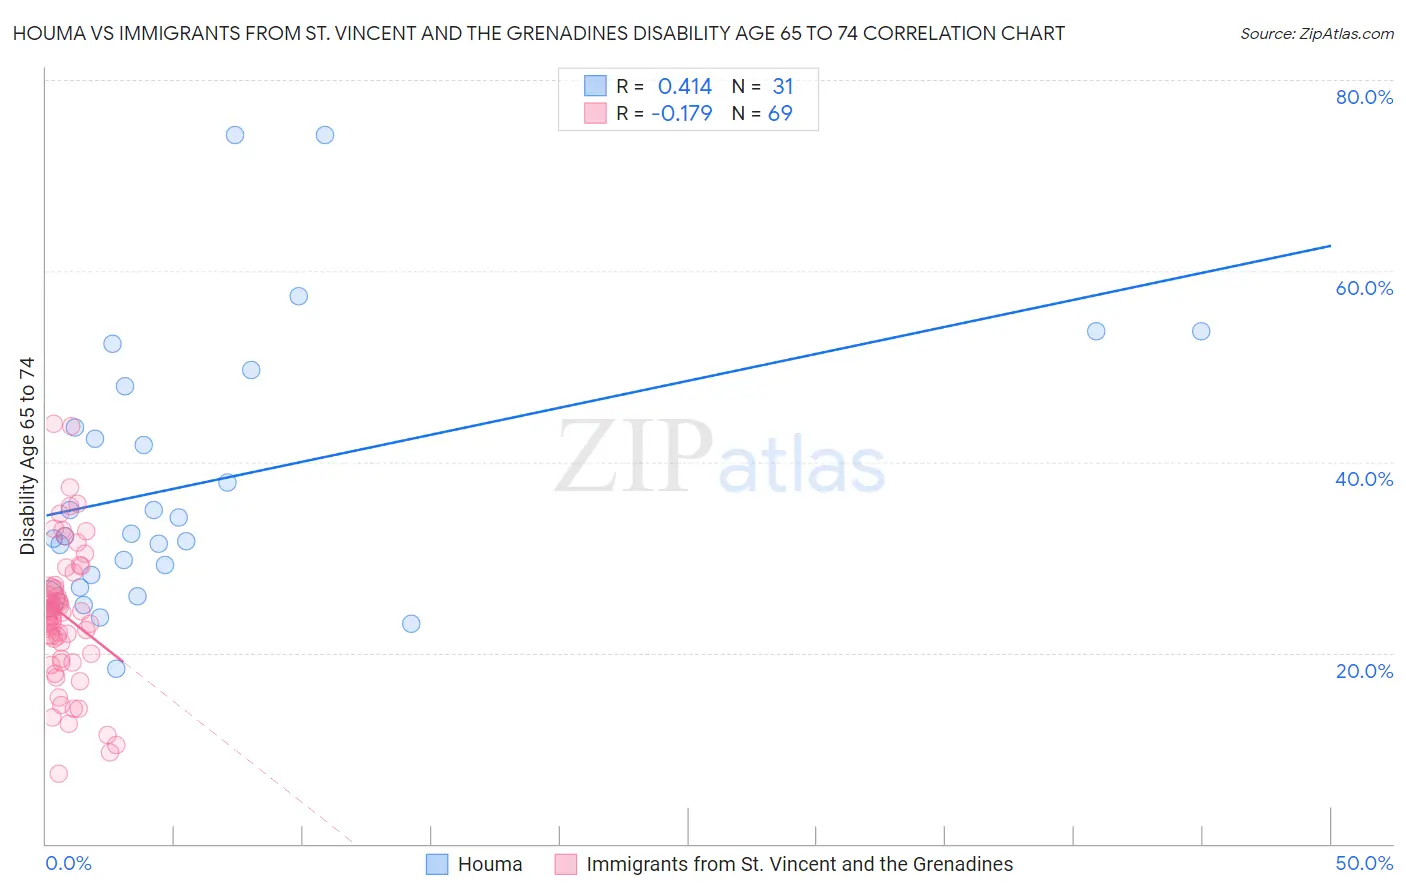
Houma vs Immigrants from St. Vincent and the Grenadines Disability Age 65 to 74 Correlation Chart
The statistical analysis conducted on geographies consisting of 36,769,608 people shows a moderate positive correlation between the proportion of Houma and percentage of population with a disability between the ages 65 and 75 in the United States with a correlation coefficient (R) of 0.414 and weighted average of 32.3%. Similarly, the statistical analysis conducted on geographies consisting of 56,167,311 people shows a poor negative correlation between the proportion of Immigrants from St. Vincent and the Grenadines and percentage of population with a disability between the ages 65 and 75 in the United States with a correlation coefficient (R) of -0.179 and weighted average of 23.7%, a difference of 36.3%.
Disability Age 65 to 74 Correlation Summary
| Measurement | Houma | Immigrants from St. Vincent and the Grenadines |
| Minimum | 18.4% | 7.4% |
| Maximum | 74.2% | 44.0% |
| Range | 55.8% | 36.6% |
| Mean | 38.1% | 23.9% |
| Median | 32.5% | 23.9% |
| Interquartile 25% (IQ1) | 28.1% | 19.6% |
| Interquartile 75% (IQ3) | 47.9% | 27.0% |
| Interquartile Range (IQR) | 19.8% | 7.3% |
| Standard Deviation (Sample) | 14.0% | 7.3% |
| Standard Deviation (Population) | 13.8% | 7.2% |
Similar Demographics by Disability Age 65 to 74
Demographics Similar to Houma by Disability Age 65 to 74
In terms of disability age 65 to 74, the demographic groups most similar to Houma are Alaskan Athabascan (32.4%, a difference of 0.19%), Kiowa (32.6%, a difference of 0.81%), Lumbee (32.7%, a difference of 1.3%), Tsimshian (32.9%, a difference of 1.9%), and Pueblo (33.1%, a difference of 2.5%).
| Demographics | Rating | Rank | Disability Age 65 to 74 |
| Creek | 0.0 /100 | #330 | Tragic 30.2% |
| Chickasaw | 0.0 /100 | #331 | Tragic 30.2% |
| Natives/Alaskans | 0.0 /100 | #332 | Tragic 30.4% |
| Colville | 0.0 /100 | #333 | Tragic 30.5% |
| Alaska Natives | 0.0 /100 | #334 | Tragic 30.6% |
| Cheyenne | 0.0 /100 | #335 | Tragic 31.1% |
| Yuman | 0.0 /100 | #336 | Tragic 31.5% |
| Houma | 0.0 /100 | #337 | Tragic 32.3% |
| Alaskan Athabascans | 0.0 /100 | #338 | Tragic 32.4% |
| Kiowa | 0.0 /100 | #339 | Tragic 32.6% |
| Lumbee | 0.0 /100 | #340 | Tragic 32.7% |
| Tsimshian | 0.0 /100 | #341 | Tragic 32.9% |
| Pueblo | 0.0 /100 | #342 | Tragic 33.1% |
| Navajo | 0.0 /100 | #343 | Tragic 33.3% |
| Inupiat | 0.0 /100 | #344 | Tragic 34.5% |
Demographics Similar to Immigrants from St. Vincent and the Grenadines by Disability Age 65 to 74
In terms of disability age 65 to 74, the demographic groups most similar to Immigrants from St. Vincent and the Grenadines are Immigrants from Trinidad and Tobago (23.7%, a difference of 0.0%), Immigrants (23.7%, a difference of 0.020%), Sudanese (23.7%, a difference of 0.13%), Immigrants from Africa (23.7%, a difference of 0.13%), and Welsh (23.7%, a difference of 0.13%).
| Demographics | Rating | Rank | Disability Age 65 to 74 |
| Immigrants | Cuba | 34.0 /100 | #188 | Fair 23.6% |
| Scottish | 33.1 /100 | #189 | Fair 23.6% |
| Immigrants | Guyana | 31.2 /100 | #190 | Fair 23.6% |
| Immigrants | Bangladesh | 30.2 /100 | #191 | Fair 23.6% |
| Ecuadorians | 29.7 /100 | #192 | Fair 23.6% |
| English | 28.5 /100 | #193 | Fair 23.6% |
| Sudanese | 27.8 /100 | #194 | Fair 23.7% |
| Immigrants | St. Vincent and the Grenadines | 26.1 /100 | #195 | Fair 23.7% |
| Immigrants | Trinidad and Tobago | 26.1 /100 | #196 | Fair 23.7% |
| Immigrants | Immigrants | 25.8 /100 | #197 | Fair 23.7% |
| Immigrants | Africa | 24.4 /100 | #198 | Fair 23.7% |
| Welsh | 24.3 /100 | #199 | Fair 23.7% |
| French Canadians | 24.0 /100 | #200 | Fair 23.7% |
| Immigrants | Ecuador | 23.9 /100 | #201 | Fair 23.7% |
| Immigrants | Bahamas | 23.3 /100 | #202 | Fair 23.7% |