British vs Immigrants from St. Vincent and the Grenadines Disability Age 65 to 74
COMPARE
British
Immigrants from St. Vincent and the Grenadines
Disability Age 65 to 74
Disability Age 65 to 74 Comparison
British
Immigrants from St. Vincent and the Grenadines
23.0%
DISABILITY AGE 65 TO 74
73.9/ 100
METRIC RATING
155th/ 347
METRIC RANK
23.7%
DISABILITY AGE 65 TO 74
26.1/ 100
METRIC RATING
195th/ 347
METRIC RANK
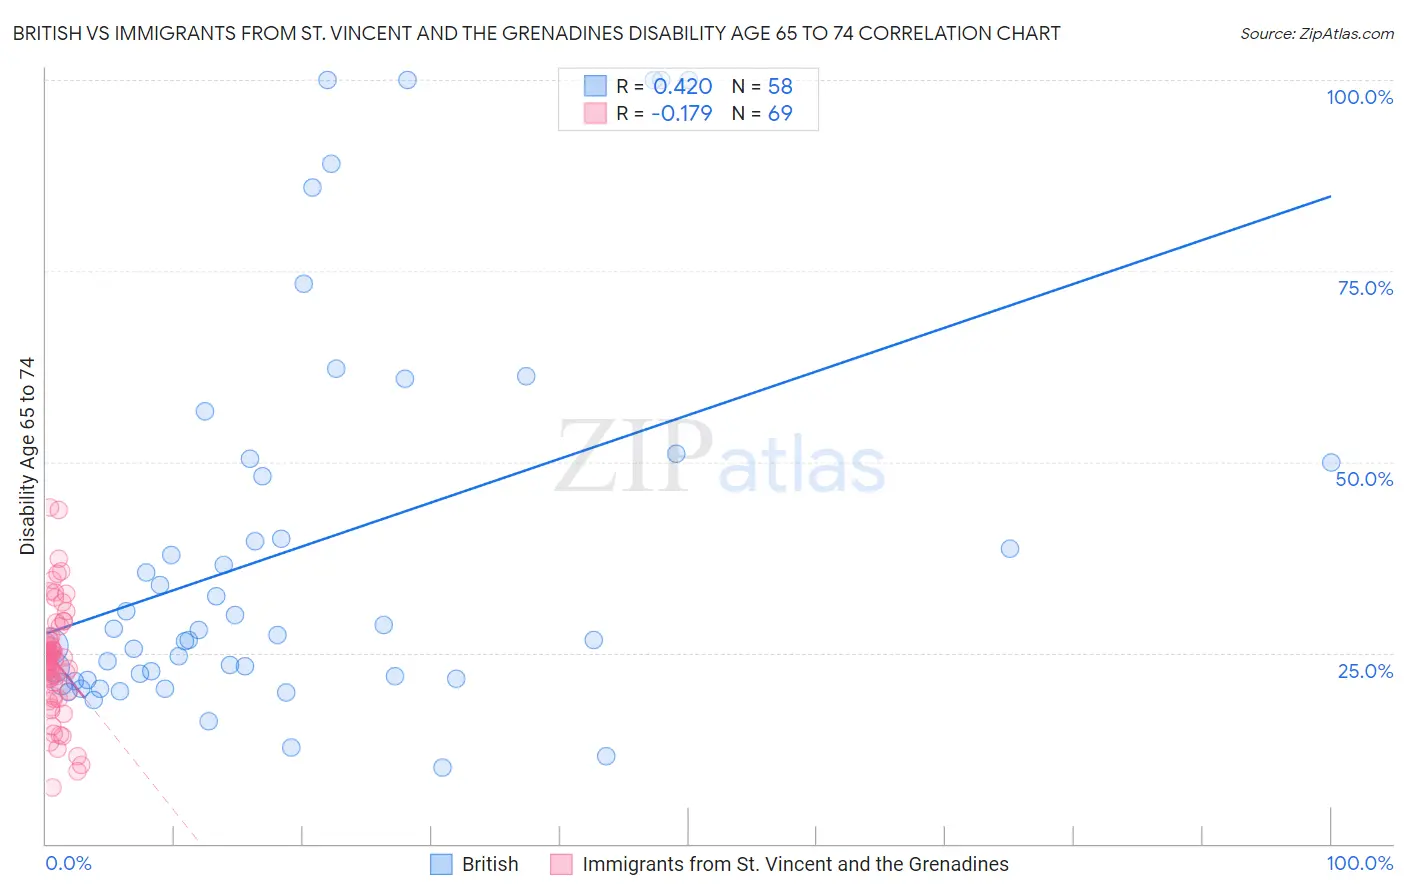
British vs Immigrants from St. Vincent and the Grenadines Disability Age 65 to 74 Correlation Chart
The statistical analysis conducted on geographies consisting of 529,866,970 people shows a moderate positive correlation between the proportion of British and percentage of population with a disability between the ages 65 and 75 in the United States with a correlation coefficient (R) of 0.420 and weighted average of 23.0%. Similarly, the statistical analysis conducted on geographies consisting of 56,167,311 people shows a poor negative correlation between the proportion of Immigrants from St. Vincent and the Grenadines and percentage of population with a disability between the ages 65 and 75 in the United States with a correlation coefficient (R) of -0.179 and weighted average of 23.7%, a difference of 3.1%.
Disability Age 65 to 74 Correlation Summary
| Measurement | British | Immigrants from St. Vincent and the Grenadines |
| Minimum | 10.0% | 7.4% |
| Maximum | 100.0% | 44.0% |
| Range | 90.0% | 36.6% |
| Mean | 38.7% | 23.9% |
| Median | 27.6% | 23.9% |
| Interquartile 25% (IQ1) | 21.6% | 19.6% |
| Interquartile 75% (IQ3) | 50.0% | 27.0% |
| Interquartile Range (IQR) | 28.4% | 7.3% |
| Standard Deviation (Sample) | 25.5% | 7.3% |
| Standard Deviation (Population) | 25.2% | 7.2% |
Similar Demographics by Disability Age 65 to 74
Demographics Similar to British by Disability Age 65 to 74
In terms of disability age 65 to 74, the demographic groups most similar to British are Sri Lankan (23.0%, a difference of 0.010%), Immigrants from Western Asia (23.0%, a difference of 0.010%), Slavic (23.0%, a difference of 0.10%), Czechoslovakian (23.0%, a difference of 0.11%), and Finnish (22.9%, a difference of 0.21%).
| Demographics | Rating | Rank | Disability Age 65 to 74 |
| New Zealanders | 79.9 /100 | #148 | Good 22.9% |
| Swiss | 79.7 /100 | #149 | Good 22.9% |
| Canadians | 77.7 /100 | #150 | Good 22.9% |
| Immigrants | Morocco | 77.6 /100 | #151 | Good 22.9% |
| Finns | 76.5 /100 | #152 | Good 22.9% |
| Slavs | 75.2 /100 | #153 | Good 23.0% |
| Sri Lankans | 74.0 /100 | #154 | Good 23.0% |
| British | 73.9 /100 | #155 | Good 23.0% |
| Immigrants | Western Asia | 73.8 /100 | #156 | Good 23.0% |
| Czechoslovakians | 72.4 /100 | #157 | Good 23.0% |
| Immigrants | Vietnam | 69.1 /100 | #158 | Good 23.1% |
| South American Indians | 65.5 /100 | #159 | Good 23.1% |
| Koreans | 64.2 /100 | #160 | Good 23.1% |
| Immigrants | Cameroon | 63.8 /100 | #161 | Good 23.1% |
| Europeans | 61.2 /100 | #162 | Good 23.2% |
Demographics Similar to Immigrants from St. Vincent and the Grenadines by Disability Age 65 to 74
In terms of disability age 65 to 74, the demographic groups most similar to Immigrants from St. Vincent and the Grenadines are Immigrants from Trinidad and Tobago (23.7%, a difference of 0.0%), Immigrants (23.7%, a difference of 0.020%), Sudanese (23.7%, a difference of 0.13%), Immigrants from Africa (23.7%, a difference of 0.13%), and Welsh (23.7%, a difference of 0.13%).
| Demographics | Rating | Rank | Disability Age 65 to 74 |
| Immigrants | Cuba | 34.0 /100 | #188 | Fair 23.6% |
| Scottish | 33.1 /100 | #189 | Fair 23.6% |
| Immigrants | Guyana | 31.2 /100 | #190 | Fair 23.6% |
| Immigrants | Bangladesh | 30.2 /100 | #191 | Fair 23.6% |
| Ecuadorians | 29.7 /100 | #192 | Fair 23.6% |
| English | 28.5 /100 | #193 | Fair 23.6% |
| Sudanese | 27.8 /100 | #194 | Fair 23.7% |
| Immigrants | St. Vincent and the Grenadines | 26.1 /100 | #195 | Fair 23.7% |
| Immigrants | Trinidad and Tobago | 26.1 /100 | #196 | Fair 23.7% |
| Immigrants | Immigrants | 25.8 /100 | #197 | Fair 23.7% |
| Immigrants | Africa | 24.4 /100 | #198 | Fair 23.7% |
| Welsh | 24.3 /100 | #199 | Fair 23.7% |
| French Canadians | 24.0 /100 | #200 | Fair 23.7% |
| Immigrants | Ecuador | 23.9 /100 | #201 | Fair 23.7% |
| Immigrants | Bahamas | 23.3 /100 | #202 | Fair 23.7% |