Honduran vs Immigrants from Dominica Disability Age Over 75
COMPARE
Honduran
Immigrants from Dominica
Disability Age Over 75
Disability Age Over 75 Comparison
Hondurans
Immigrants from Dominica
48.9%
DISABILITY AGE OVER 75
0.3/ 100
METRIC RATING
265th/ 347
METRIC RANK
49.1%
DISABILITY AGE OVER 75
0.1/ 100
METRIC RATING
275th/ 347
METRIC RANK
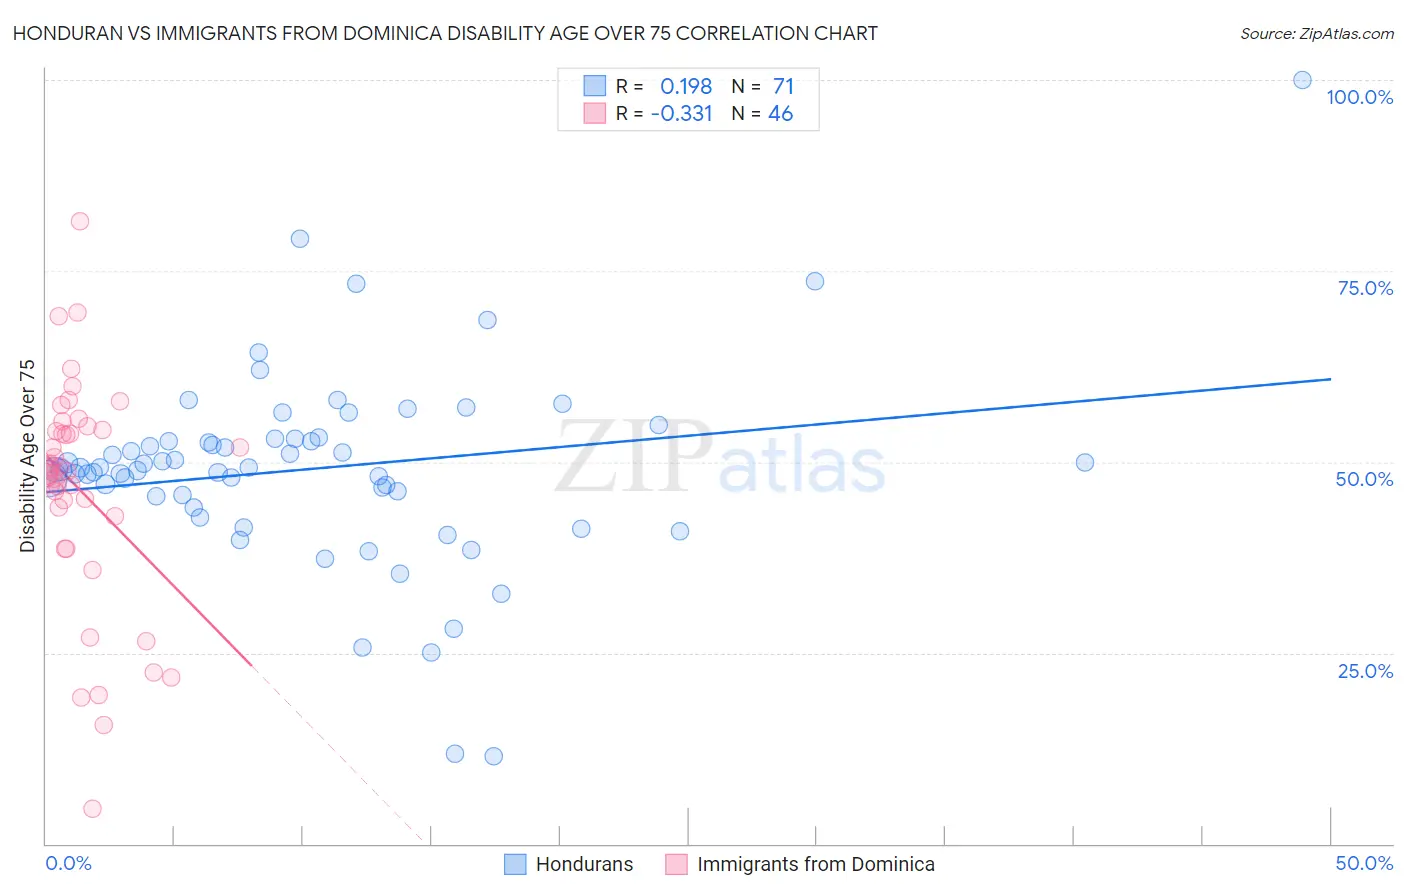
Honduran vs Immigrants from Dominica Disability Age Over 75 Correlation Chart
The statistical analysis conducted on geographies consisting of 357,151,791 people shows a poor positive correlation between the proportion of Hondurans and percentage of population with a disability over the age of 75 in the United States with a correlation coefficient (R) of 0.198 and weighted average of 48.9%. Similarly, the statistical analysis conducted on geographies consisting of 83,692,504 people shows a mild negative correlation between the proportion of Immigrants from Dominica and percentage of population with a disability over the age of 75 in the United States with a correlation coefficient (R) of -0.331 and weighted average of 49.1%, a difference of 0.39%.
Disability Age Over 75 Correlation Summary
| Measurement | Honduran | Immigrants from Dominica |
| Minimum | 11.4% | 4.6% |
| Maximum | 100.0% | 81.5% |
| Range | 88.6% | 76.9% |
| Mean | 49.1% | 46.3% |
| Median | 49.2% | 49.0% |
| Interquartile 25% (IQ1) | 45.5% | 42.9% |
| Interquartile 75% (IQ3) | 53.0% | 54.2% |
| Interquartile Range (IQR) | 7.6% | 11.4% |
| Standard Deviation (Sample) | 13.0% | 15.0% |
| Standard Deviation (Population) | 12.9% | 14.8% |
Demographics Similar to Hondurans and Immigrants from Dominica by Disability Age Over 75
In terms of disability age over 75, the demographic groups most similar to Hondurans are Immigrants from Honduras (48.9%, a difference of 0.010%), U.S. Virgin Islander (48.9%, a difference of 0.030%), Salvadoran (48.9%, a difference of 0.060%), Immigrants from West Indies (48.9%, a difference of 0.080%), and African (48.9%, a difference of 0.14%). Similarly, the demographic groups most similar to Immigrants from Dominica are Immigrants from Guatemala (49.1%, a difference of 0.010%), Immigrants from Iraq (49.1%, a difference of 0.080%), Immigrants from Uzbekistan (49.2%, a difference of 0.12%), Assyrian/Chaldean/Syriac (49.1%, a difference of 0.14%), and Hawaiian (49.2%, a difference of 0.14%).
| Demographics | Rating | Rank | Disability Age Over 75 |
| Immigrants | Afghanistan | 0.4 /100 | #260 | Tragic 48.8% |
| Africans | 0.3 /100 | #261 | Tragic 48.9% |
| Immigrants | West Indies | 0.3 /100 | #262 | Tragic 48.9% |
| Salvadorans | 0.3 /100 | #263 | Tragic 48.9% |
| Immigrants | Honduras | 0.3 /100 | #264 | Tragic 48.9% |
| Hondurans | 0.3 /100 | #265 | Tragic 48.9% |
| U.S. Virgin Islanders | 0.2 /100 | #266 | Tragic 48.9% |
| Malaysians | 0.2 /100 | #267 | Tragic 49.0% |
| Guatemalans | 0.2 /100 | #268 | Tragic 49.0% |
| Immigrants | El Salvador | 0.2 /100 | #269 | Tragic 49.0% |
| Potawatomi | 0.2 /100 | #270 | Tragic 49.0% |
| Fijians | 0.2 /100 | #271 | Tragic 49.0% |
| Assyrians/Chaldeans/Syriacs | 0.2 /100 | #272 | Tragic 49.1% |
| Immigrants | Iraq | 0.1 /100 | #273 | Tragic 49.1% |
| Immigrants | Guatemala | 0.1 /100 | #274 | Tragic 49.1% |
| Immigrants | Dominica | 0.1 /100 | #275 | Tragic 49.1% |
| Immigrants | Uzbekistan | 0.1 /100 | #276 | Tragic 49.2% |
| Hawaiians | 0.1 /100 | #277 | Tragic 49.2% |
| Immigrants | Laos | 0.1 /100 | #278 | Tragic 49.2% |
| Guamanians/Chamorros | 0.0 /100 | #279 | Tragic 49.4% |
| Bangladeshis | 0.0 /100 | #280 | Tragic 49.4% |