Immigrants from Congo vs Immigrants from Dominica Disability Age Over 75
COMPARE
Immigrants from Congo
Immigrants from Dominica
Disability Age Over 75
Disability Age Over 75 Comparison
Immigrants from Congo
Immigrants from Dominica
48.7%
DISABILITY AGE OVER 75
0.5/ 100
METRIC RATING
256th/ 347
METRIC RANK
49.1%
DISABILITY AGE OVER 75
0.1/ 100
METRIC RATING
275th/ 347
METRIC RANK
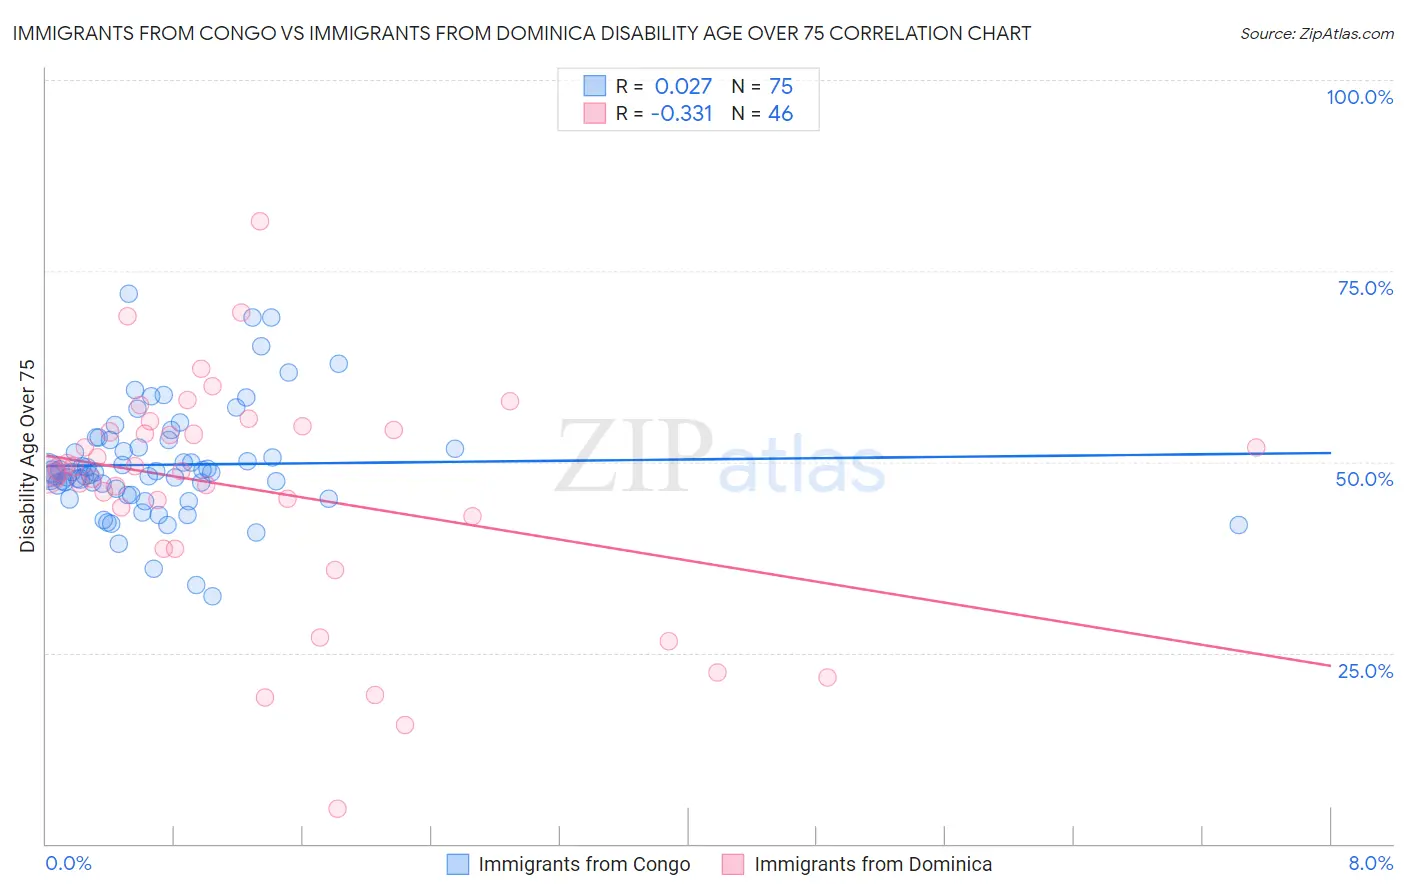
Immigrants from Congo vs Immigrants from Dominica Disability Age Over 75 Correlation Chart
The statistical analysis conducted on geographies consisting of 92,072,381 people shows no correlation between the proportion of Immigrants from Congo and percentage of population with a disability over the age of 75 in the United States with a correlation coefficient (R) of 0.027 and weighted average of 48.7%. Similarly, the statistical analysis conducted on geographies consisting of 83,692,504 people shows a mild negative correlation between the proportion of Immigrants from Dominica and percentage of population with a disability over the age of 75 in the United States with a correlation coefficient (R) of -0.331 and weighted average of 49.1%, a difference of 0.80%.
Disability Age Over 75 Correlation Summary
| Measurement | Immigrants from Congo | Immigrants from Dominica |
| Minimum | 32.4% | 4.6% |
| Maximum | 72.0% | 81.5% |
| Range | 39.6% | 76.9% |
| Mean | 49.6% | 46.3% |
| Median | 48.6% | 49.0% |
| Interquartile 25% (IQ1) | 45.7% | 42.9% |
| Interquartile 75% (IQ3) | 52.8% | 54.2% |
| Interquartile Range (IQR) | 7.1% | 11.4% |
| Standard Deviation (Sample) | 7.3% | 15.0% |
| Standard Deviation (Population) | 7.2% | 14.8% |
Demographics Similar to Immigrants from Congo and Immigrants from Dominica by Disability Age Over 75
In terms of disability age over 75, the demographic groups most similar to Immigrants from Congo are Chinese (48.7%, a difference of 0.010%), Blackfeet (48.8%, a difference of 0.050%), Immigrants from Philippines (48.8%, a difference of 0.090%), Central American (48.8%, a difference of 0.17%), and Immigrants from Afghanistan (48.8%, a difference of 0.21%). Similarly, the demographic groups most similar to Immigrants from Dominica are Immigrants from Guatemala (49.1%, a difference of 0.010%), Immigrants from Iraq (49.1%, a difference of 0.080%), Assyrian/Chaldean/Syriac (49.1%, a difference of 0.14%), Fijian (49.0%, a difference of 0.15%), and Potawatomi (49.0%, a difference of 0.17%).
| Demographics | Rating | Rank | Disability Age Over 75 |
| Chinese | 0.5 /100 | #255 | Tragic 48.7% |
| Immigrants | Congo | 0.5 /100 | #256 | Tragic 48.7% |
| Blackfeet | 0.5 /100 | #257 | Tragic 48.8% |
| Immigrants | Philippines | 0.4 /100 | #258 | Tragic 48.8% |
| Central Americans | 0.4 /100 | #259 | Tragic 48.8% |
| Immigrants | Afghanistan | 0.4 /100 | #260 | Tragic 48.8% |
| Africans | 0.3 /100 | #261 | Tragic 48.9% |
| Immigrants | West Indies | 0.3 /100 | #262 | Tragic 48.9% |
| Salvadorans | 0.3 /100 | #263 | Tragic 48.9% |
| Immigrants | Honduras | 0.3 /100 | #264 | Tragic 48.9% |
| Hondurans | 0.3 /100 | #265 | Tragic 48.9% |
| U.S. Virgin Islanders | 0.2 /100 | #266 | Tragic 48.9% |
| Malaysians | 0.2 /100 | #267 | Tragic 49.0% |
| Guatemalans | 0.2 /100 | #268 | Tragic 49.0% |
| Immigrants | El Salvador | 0.2 /100 | #269 | Tragic 49.0% |
| Potawatomi | 0.2 /100 | #270 | Tragic 49.0% |
| Fijians | 0.2 /100 | #271 | Tragic 49.0% |
| Assyrians/Chaldeans/Syriacs | 0.2 /100 | #272 | Tragic 49.1% |
| Immigrants | Iraq | 0.1 /100 | #273 | Tragic 49.1% |
| Immigrants | Guatemala | 0.1 /100 | #274 | Tragic 49.1% |
| Immigrants | Dominica | 0.1 /100 | #275 | Tragic 49.1% |