Hmong vs Colombian Disability Age 65 to 74

COMPARE

Hmong
Race
Ancestry
AfghanAfricanAlaska NativeAlaskan AthabascanAlbanianAleutAlsatianAmericanApacheArabArapahoArgentineanArmenianAssyrian/Chaldean/SyriacAustralianAustrianBahamianBangladeshiBarbadianBasqueBelgianBelizeanBermudanBhutaneseBlackfeetBolivianBrazilianBritishBritish West IndianBulgarianBurmeseCajunCambodianCanadianCape VerdeanCarpatho RusynCelticCentral AmericanCentral American IndianCherokeeCheyenneChickasawChileanChineseChippewaChoctawColvilleComancheCosta RicanCreeCreekCroatianCrowCubanCypriotCzechCzechoslovakianDanishDelawareDominicanDutchDutch West IndianEastern EuropeanEcuadorianEgyptianEnglishEstonianEthiopianEuropeanFijianFilipinoFinnishFrenchFrench American IndianFrench CanadianGermanGerman RussianGhanaianGreekGuamanian/ChamorroGuatemalanGuyaneseHaitianHmongHonduranHopiHoumaHungarianIcelanderIndian (Asian)IndonesianInupiatIranianIraqiIrishIroquoisIsraeliItalianJamaicanJapaneseJordanianKenyanKiowaKoreanLaotianLatvianLebaneseLiberianLithuanianLumbeeLuxembourgerMacedonianMalaysianMalteseMarshalleseMenomineeMexicanMexican American IndianMongolianMoroccanNative HawaiianNavajoNepaleseNew ZealanderNicaraguanNigerianNorthern EuropeanNorwegianOkinawanOsageOttawaPaiutePakistaniPalestinianPanamanianParaguayanPennsylvania GermanPeruvianPimaPolishPortuguesePotawatomiPuebloPuerto RicanPuget Sound SalishRomanianRussianSalvadoranSamoanScandinavianScotch-IrishScottishSeminoleSenegaleseSerbianShoshoneSierra LeoneanSiouxSlavicSlovakSloveneSomaliSouth AfricanSouth AmericanSouth American IndianSoviet UnionSpaniardSpanishSpanish AmericanSpanish American IndianSri LankanSubsaharan AfricanSudaneseSwedishSwissSyrianTaiwaneseThaiTlingit-HaidaTohono O'OdhamTonganTrinidadian and TobagonianTsimshianTurkishU.S. Virgin IslanderUgandanUkrainianUruguayanUteVenezuelanVietnameseWelshWest IndianYakamaYaquiYugoslavianYumanYup'ikZimbabwean
Immigration
NonimmigrantsImmigrantsAfghanistanAfricaAlbaniaArgentinaArmeniaAsiaAustraliaAustriaBahamasBangladeshBarbadosBelarusBelgiumBelizeBoliviaBosnia and HerzegovinaBrazilBulgariaBurma/MyanmarCabo VerdeCambodiaCameroonCanadaCaribbeanCentral AmericaChileChinaColombiaCongoCosta RicaCroatiaCubaCzechoslovakiaDenmarkDominicaDominican RepublicEastern AfricaEastern AsiaEastern EuropeEcuadorEgyptEl SalvadorEnglandEritreaEthiopiaEuropeFijiFranceGermanyGhanaGreeceGrenadaGuatemalaGuyanaHaitiHondurasHong KongHungaryIndiaIndonesiaIranIraqIrelandIsraelItalyJamaicaJapanJordanKazakhstanKenyaKoreaKuwaitLaosLatin AmericaLatviaLebanonLiberiaLithuaniaMalaysiaMexicoMicronesiaMiddle AfricaMoldovaMoroccoNepalNetherlandsNicaraguaNigeriaNorth AmericaNorth MacedoniaNorthern AfricaNorthern EuropeNorwayOceaniaPakistanPanamaPeruPhilippinesPolandPortugalRomaniaRussiaSaudi ArabiaScotlandSenegalSerbiaSierra LeoneSingaporeSomaliaSouth AfricaSouth AmericaSouth Central AsiaSouth Eastern AsiaSouthern EuropeSpainSri LankaSt. Vincent and the GrenadinesSudanSwedenSwitzerlandSyriaTaiwanThailandTrinidad and TobagoTurkeyUgandaUkraineUruguayUzbekistanVenezuelaVietnamWest IndiesWestern AfricaWestern AsiaWestern EuropeYemenZaireZimbabweAzores
Colombian
Race
Ancestry
AfghanAfricanAlaska NativeAlaskan AthabascanAlbanianAleutAlsatianAmericanApacheArabArapahoArgentineanArmenianAssyrian/Chaldean/SyriacAustralianAustrianBahamianBangladeshiBarbadianBasqueBelgianBelizeanBermudanBhutaneseBlackfeetBolivianBrazilianBritishBritish West IndianBulgarianBurmeseCajunCambodianCanadianCape VerdeanCarpatho RusynCelticCentral AmericanCentral American IndianCherokeeCheyenneChickasawChileanChineseChippewaChoctawColombianColvilleComancheCosta RicanCreeCreekCroatianCrowCubanCypriotCzechCzechoslovakianDanishDelawareDominicanDutchDutch West IndianEastern EuropeanEcuadorianEgyptianEnglishEstonianEthiopianEuropeanFijianFilipinoFinnishFrenchFrench American IndianFrench CanadianGermanGerman RussianGhanaianGreekGuamanian/ChamorroGuatemalanGuyaneseHaitianHonduranHopiHoumaHungarianIcelanderIndian (Asian)IndonesianInupiatIranianIraqiIrishIroquoisIsraeliItalianJamaicanJapaneseJordanianKenyanKiowaKoreanLaotianLatvianLebaneseLiberianLithuanianLumbeeLuxembourgerMacedonianMalaysianMalteseMarshalleseMenomineeMexicanMexican American IndianMongolianMoroccanNative HawaiianNavajoNepaleseNew ZealanderNicaraguanNigerianNorthern EuropeanNorwegianOkinawanOsageOttawaPaiutePakistaniPalestinianPanamanianParaguayanPennsylvania GermanPeruvianPimaPolishPortuguesePotawatomiPuebloPuerto RicanPuget Sound SalishRomanianRussianSalvadoranSamoanScandinavianScotch-IrishScottishSeminoleSenegaleseSerbianShoshoneSierra LeoneanSiouxSlavicSlovakSloveneSomaliSouth AfricanSouth AmericanSouth American IndianSoviet UnionSpaniardSpanishSpanish AmericanSpanish American IndianSri LankanSubsaharan AfricanSudaneseSwedishSwissSyrianTaiwaneseThaiTlingit-HaidaTohono O'OdhamTonganTrinidadian and TobagonianTsimshianTurkishU.S. Virgin IslanderUgandanUkrainianUruguayanUteVenezuelanVietnameseWelshWest IndianYakamaYaquiYugoslavianYumanYup'ikZimbabwean
Immigration
NonimmigrantsImmigrantsAfghanistanAfricaAlbaniaArgentinaArmeniaAsiaAustraliaAustriaBahamasBangladeshBarbadosBelarusBelgiumBelizeBoliviaBosnia and HerzegovinaBrazilBulgariaBurma/MyanmarCabo VerdeCambodiaCameroonCanadaCaribbeanCentral AmericaChileChinaColombiaCongoCosta RicaCroatiaCubaCzechoslovakiaDenmarkDominicaDominican RepublicEastern AfricaEastern AsiaEastern EuropeEcuadorEgyptEl SalvadorEnglandEritreaEthiopiaEuropeFijiFranceGermanyGhanaGreeceGrenadaGuatemalaGuyanaHaitiHondurasHong KongHungaryIndiaIndonesiaIranIraqIrelandIsraelItalyJamaicaJapanJordanKazakhstanKenyaKoreaKuwaitLaosLatin AmericaLatviaLebanonLiberiaLithuaniaMalaysiaMexicoMicronesiaMiddle AfricaMoldovaMoroccoNepalNetherlandsNicaraguaNigeriaNorth AmericaNorth MacedoniaNorthern AfricaNorthern EuropeNorwayOceaniaPakistanPanamaPeruPhilippinesPolandPortugalRomaniaRussiaSaudi ArabiaScotlandSenegalSerbiaSierra LeoneSingaporeSomaliaSouth AfricaSouth AmericaSouth Central AsiaSouth Eastern AsiaSouthern EuropeSpainSri LankaSt. Vincent and the GrenadinesSudanSwedenSwitzerlandSyriaTaiwanThailandTrinidad and TobagoTurkeyUgandaUkraineUruguayUzbekistanVenezuelaVietnamWest IndiesWestern AfricaWestern AsiaWestern EuropeYemenZaireZimbabweAzores
Disability Age 65 to 74
Income
Poverty
Unemployment
Labor Participation
Family Structure
Vehicle Availability
Education Level
Disability

Disability Age 65 to 74 Comparison

Hmong

Colombians

Tragic
Exceptional
25.7%
DISABILITY AGE 65 TO 74
0.1/ 100
METRIC RATING
269th/ 347
METRIC RANK
22.2%
DISABILITY AGE 65 TO 74
96.4/ 100
METRIC RATING
104th/ 347
METRIC RANK

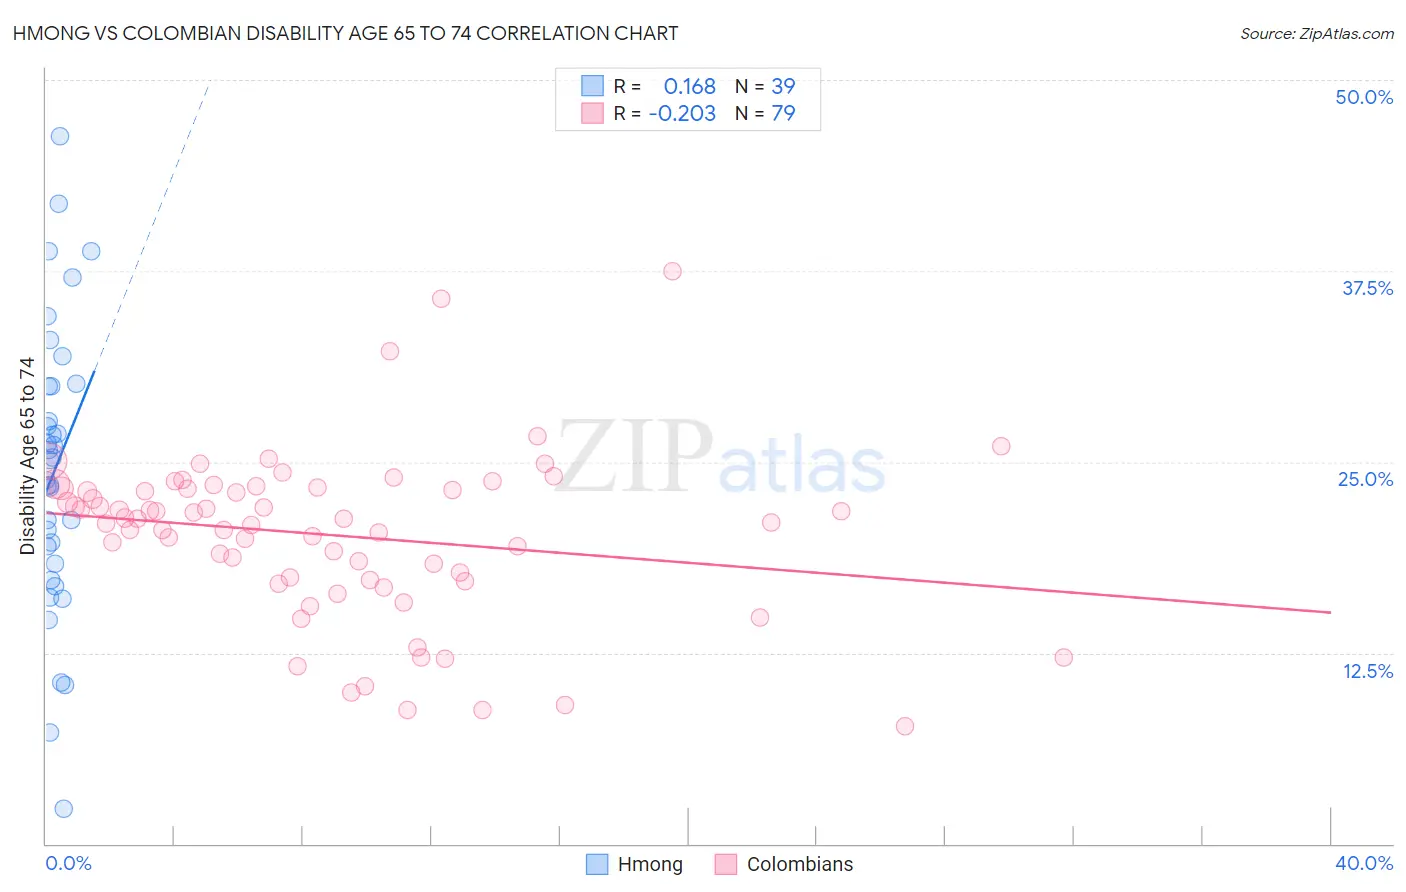
Hmong vs Colombian Disability Age 65 to 74 Correlation Chart

The statistical analysis conducted on geographies consisting of 24,678,157 people shows a poor positive correlation between the proportion of Hmong and percentage of population with a disability between the ages 65 and 75 in the United States with a correlation coefficient (R) of 0.168 and weighted average of 25.7%. Similarly, the statistical analysis conducted on geographies consisting of 418,615,153 people shows a weak negative correlation between the proportion of Colombians and percentage of population with a disability between the ages 65 and 75 in the United States with a correlation coefficient (R) of -0.203 and weighted average of 22.2%, a difference of 15.4%.
Hmong vs Colombian Disability Age 65 to 74

Disability Age 65 to 74 Correlation Summary

MeasurementHmongColombian
Minimum2.3%7.7%
Maximum46.3%37.5%
Range44.0%29.8%
Mean24.5%20.2%
Median25.1%21.3%
Interquartile 25% (IQ1)18.3%17.2%
Interquartile 75% (IQ3)30.0%23.3%
Interquartile Range (IQR)11.6%6.0%
Standard Deviation (Sample)9.4%5.5%
Standard Deviation (Population)9.3%5.4%

Similar Demographics by Disability Age 65 to 74

Demographics Similar to Hmong by Disability Age 65 to 74

In terms of disability age 65 to 74, the demographic groups most similar to Hmong are Immigrants from Guatemala (25.7%, a difference of 0.080%), Immigrants from Liberia (25.7%, a difference of 0.11%), Immigrants from Dominica (25.7%, a difference of 0.11%), Liberian (25.6%, a difference of 0.12%), and Ottawa (25.6%, a difference of 0.22%).
DemographicsRating | RankDisability Age 65 to 74
Samoans
0.2
/100
|
#262
Tragic
25.4%
Iroquois
0.2
/100
|
#263
Tragic
25.4%
Hawaiians
0.2
/100
|
#264
Tragic
25.5%
Guatemalans
0.2
/100
|
#265
Tragic
25.5%
Immigrants | Latin America
0.1
/100
|
#266
Tragic
25.6%
Ottawa
0.1
/100
|
#267
Tragic
25.6%
Liberians
0.1
/100
|
#268
Tragic
25.6%
Hmong
0.1
/100
|
#269
Tragic
25.7%
Immigrants | Guatemala
0.1
/100
|
#270
Tragic
25.7%
Immigrants | Liberia
0.1
/100
|
#271
Tragic
25.7%
Immigrants | Dominica
0.1
/100
|
#272
Tragic
25.7%
Japanese
0.1
/100
|
#273
Tragic
25.7%
Americans
0.1
/100
|
#274
Tragic
25.8%
Hondurans
0.1
/100
|
#275
Tragic
25.8%
French American Indians
0.1
/100
|
#276
Tragic
25.8%

Demographics Similar to Colombians by Disability Age 65 to 74

In terms of disability age 65 to 74, the demographic groups most similar to Colombians are South American (22.2%, a difference of 0.010%), Immigrants from Saudi Arabia (22.2%, a difference of 0.030%), Palestinian (22.2%, a difference of 0.040%), Immigrants from England (22.2%, a difference of 0.060%), and Uruguayan (22.2%, a difference of 0.070%).
DemographicsRating | RankDisability Age 65 to 74
Immigrants | Southern Europe
97.2
/100
|
#97
Exceptional
22.1%
Jordanians
96.9
/100
|
#98
Exceptional
22.2%
Immigrants | Colombia
96.8
/100
|
#99
Exceptional
22.2%
Uruguayans
96.5
/100
|
#100
Exceptional
22.2%
Immigrants | England
96.5
/100
|
#101
Exceptional
22.2%
Immigrants | Saudi Arabia
96.4
/100
|
#102
Exceptional
22.2%
South Americans
96.4
/100
|
#103
Exceptional
22.2%
Colombians
96.4
/100
|
#104
Exceptional
22.2%
Palestinians
96.3
/100
|
#105
Exceptional
22.2%
Peruvians
96.1
/100
|
#106
Exceptional
22.2%
Slovenes
96.1
/100
|
#107
Exceptional
22.2%
Immigrants | Zimbabwe
96.1
/100
|
#108
Exceptional
22.3%
Albanians
95.8
/100
|
#109
Exceptional
22.3%
Immigrants | Peru
95.7
/100
|
#110
Exceptional
22.3%
Serbians
95.7
/100
|
#111
Exceptional
22.3%