Immigrants from Sweden vs Scottish Vision Disability
COMPARE
Immigrants from Sweden
Scottish
Vision Disability
Vision Disability Comparison
Immigrants from Sweden
Scottish
2.0%
VISION DISABILITY
99.7/ 100
METRIC RATING
46th/ 347
METRIC RANK
2.3%
VISION DISABILITY
1.6/ 100
METRIC RATING
234th/ 347
METRIC RANK
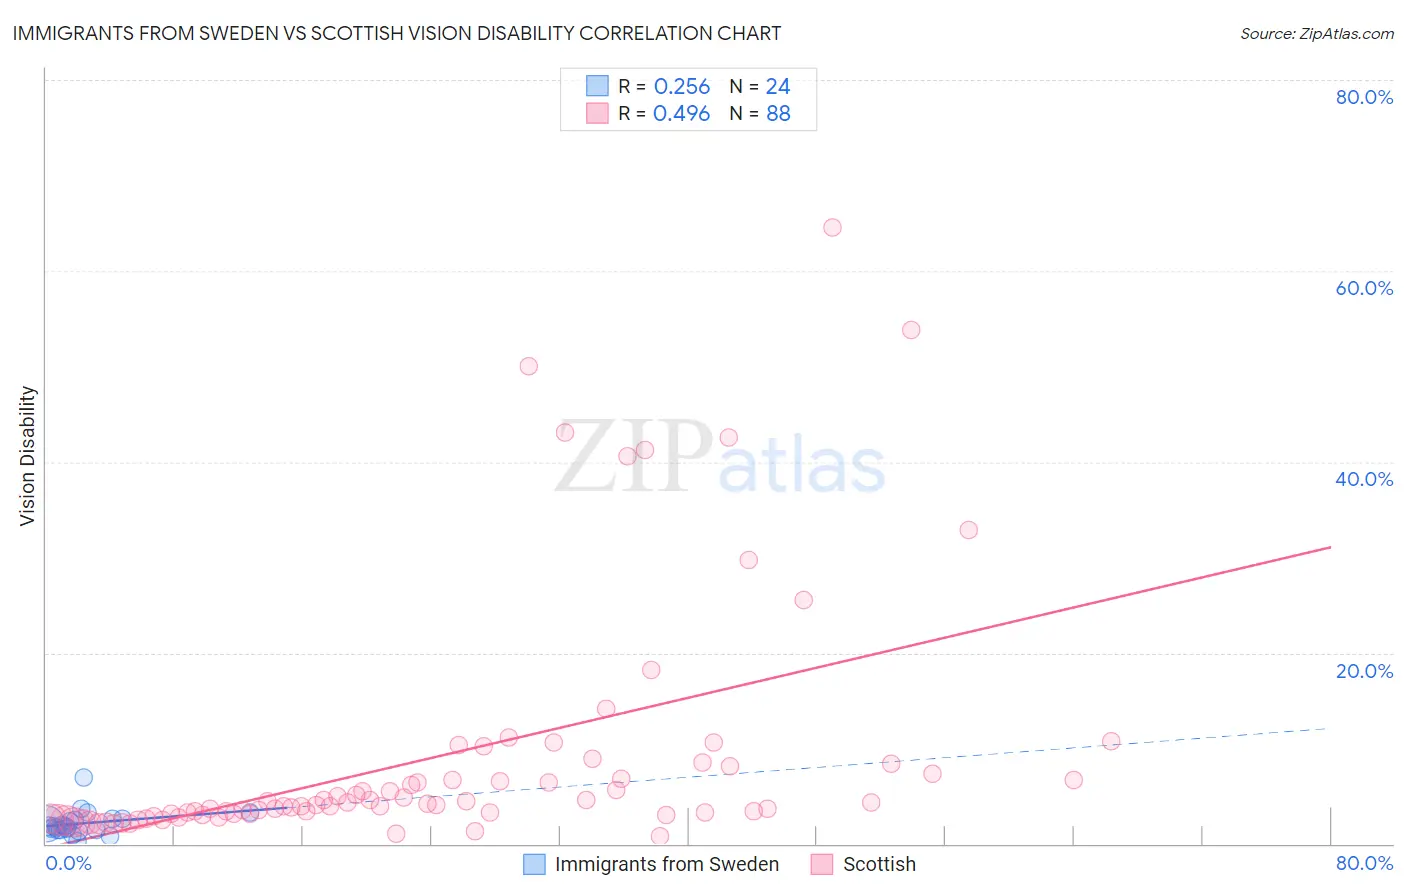
Immigrants from Sweden vs Scottish Vision Disability Correlation Chart
The statistical analysis conducted on geographies consisting of 164,685,810 people shows a weak positive correlation between the proportion of Immigrants from Sweden and percentage of population with vision disability in the United States with a correlation coefficient (R) of 0.256 and weighted average of 2.0%. Similarly, the statistical analysis conducted on geographies consisting of 565,142,315 people shows a moderate positive correlation between the proportion of Scottish and percentage of population with vision disability in the United States with a correlation coefficient (R) of 0.496 and weighted average of 2.3%, a difference of 17.0%.
Vision Disability Correlation Summary
| Measurement | Immigrants from Sweden | Scottish |
| Minimum | 0.27% | 0.83% |
| Maximum | 6.9% | 64.6% |
| Range | 6.6% | 63.8% |
| Mean | 2.1% | 9.1% |
| Median | 1.8% | 4.1% |
| Interquartile 25% (IQ1) | 1.5% | 3.0% |
| Interquartile 75% (IQ3) | 2.5% | 7.7% |
| Interquartile Range (IQR) | 1.1% | 4.7% |
| Standard Deviation (Sample) | 1.3% | 12.9% |
| Standard Deviation (Population) | 1.3% | 12.8% |
Similar Demographics by Vision Disability
Demographics Similar to Immigrants from Sweden by Vision Disability
In terms of vision disability, the demographic groups most similar to Immigrants from Sweden are Immigrants from Bulgaria (2.0%, a difference of 0.020%), Ethiopian (2.0%, a difference of 0.040%), Immigrants from Indonesia (2.0%, a difference of 0.070%), Eastern European (2.0%, a difference of 0.090%), and Immigrants from Ethiopia (2.0%, a difference of 0.15%).
| Demographics | Rating | Rank | Vision Disability |
| Zimbabweans | 99.7 /100 | #39 | Exceptional 2.0% |
| Immigrants | Ireland | 99.7 /100 | #40 | Exceptional 2.0% |
| Cypriots | 99.7 /100 | #41 | Exceptional 2.0% |
| Immigrants | Ethiopia | 99.7 /100 | #42 | Exceptional 2.0% |
| Eastern Europeans | 99.7 /100 | #43 | Exceptional 2.0% |
| Immigrants | Indonesia | 99.7 /100 | #44 | Exceptional 2.0% |
| Ethiopians | 99.7 /100 | #45 | Exceptional 2.0% |
| Immigrants | Sweden | 99.7 /100 | #46 | Exceptional 2.0% |
| Immigrants | Bulgaria | 99.7 /100 | #47 | Exceptional 2.0% |
| Israelis | 99.6 /100 | #48 | Exceptional 2.0% |
| Latvians | 99.5 /100 | #49 | Exceptional 2.0% |
| Afghans | 99.5 /100 | #50 | Exceptional 2.0% |
| Tongans | 99.5 /100 | #51 | Exceptional 2.0% |
| Immigrants | Serbia | 99.4 /100 | #52 | Exceptional 2.0% |
| Immigrants | Belarus | 99.3 /100 | #53 | Exceptional 2.0% |
Demographics Similar to Scottish by Vision Disability
In terms of vision disability, the demographic groups most similar to Scottish are Marshallese (2.3%, a difference of 0.070%), Immigrants from Congo (2.3%, a difference of 0.16%), Central American (2.3%, a difference of 0.18%), German Russian (2.3%, a difference of 0.20%), and Immigrants from Portugal (2.3%, a difference of 0.21%).
| Demographics | Rating | Rank | Vision Disability |
| Hawaiians | 2.9 /100 | #227 | Tragic 2.3% |
| Hmong | 2.5 /100 | #228 | Tragic 2.3% |
| Welsh | 2.3 /100 | #229 | Tragic 2.3% |
| Nicaraguans | 2.2 /100 | #230 | Tragic 2.3% |
| Immigrants | Ecuador | 2.0 /100 | #231 | Tragic 2.3% |
| German Russians | 1.8 /100 | #232 | Tragic 2.3% |
| Central Americans | 1.8 /100 | #233 | Tragic 2.3% |
| Scottish | 1.6 /100 | #234 | Tragic 2.3% |
| Marshallese | 1.5 /100 | #235 | Tragic 2.3% |
| Immigrants | Congo | 1.4 /100 | #236 | Tragic 2.3% |
| Immigrants | Portugal | 1.4 /100 | #237 | Tragic 2.3% |
| Immigrants | Cambodia | 1.1 /100 | #238 | Tragic 2.3% |
| English | 1.1 /100 | #239 | Tragic 2.3% |
| Panamanians | 0.9 /100 | #240 | Tragic 2.3% |
| Malaysians | 0.9 /100 | #241 | Tragic 2.3% |