Haitian vs British West Indian Disability Age Over 75
COMPARE
Haitian
British West Indian
Disability Age Over 75
Disability Age Over 75 Comparison
Haitians
British West Indians
47.4%
DISABILITY AGE OVER 75
44.6/ 100
METRIC RATING
177th/ 347
METRIC RANK
48.7%
DISABILITY AGE OVER 75
0.6/ 100
METRIC RATING
253rd/ 347
METRIC RANK
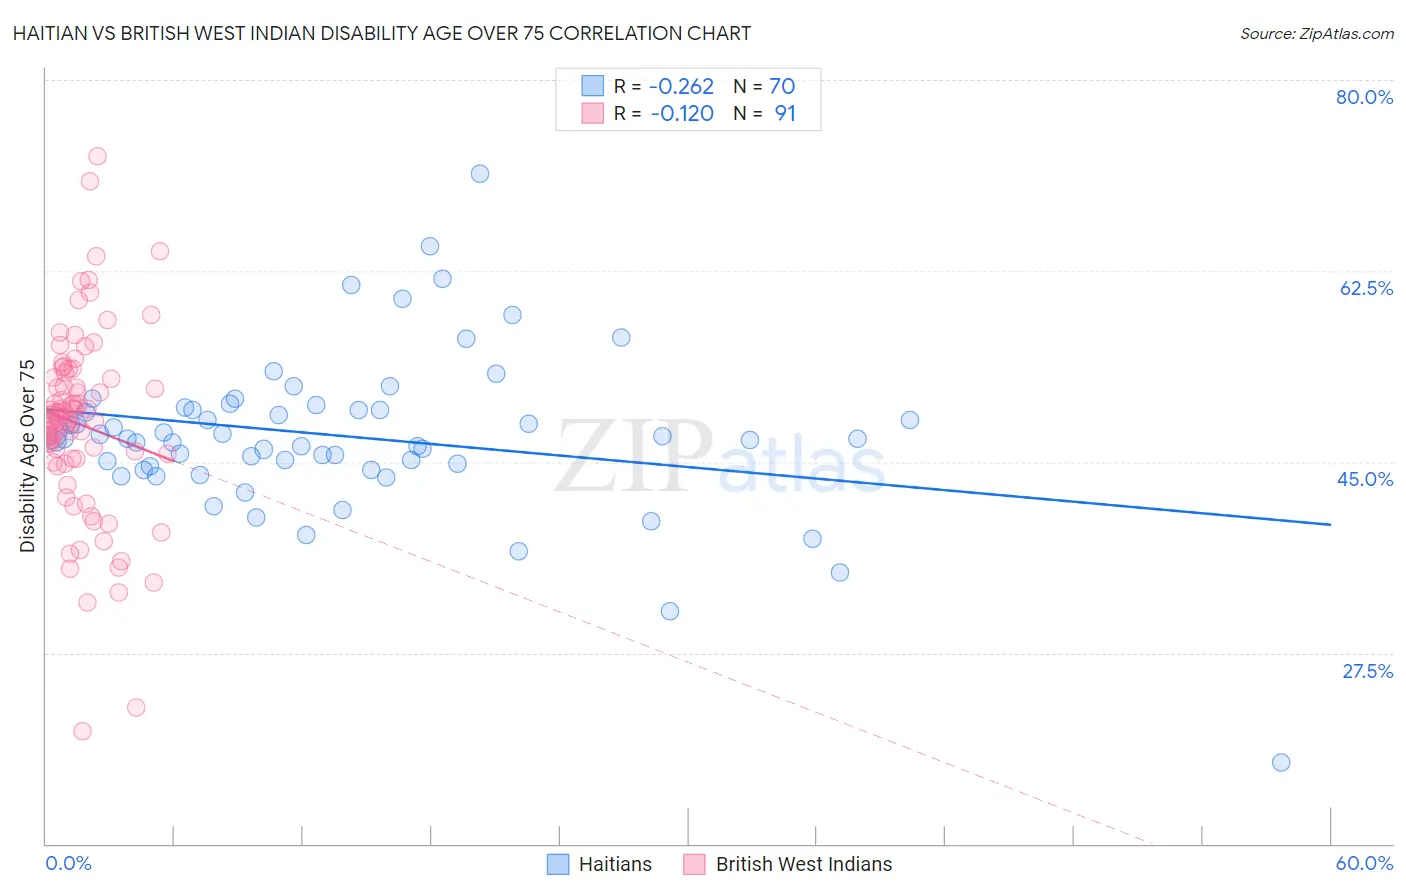
Haitian vs British West Indian Disability Age Over 75 Correlation Chart
The statistical analysis conducted on geographies consisting of 287,266,486 people shows a weak negative correlation between the proportion of Haitians and percentage of population with a disability over the age of 75 in the United States with a correlation coefficient (R) of -0.262 and weighted average of 47.4%. Similarly, the statistical analysis conducted on geographies consisting of 152,453,747 people shows a poor negative correlation between the proportion of British West Indians and percentage of population with a disability over the age of 75 in the United States with a correlation coefficient (R) of -0.120 and weighted average of 48.7%, a difference of 2.7%.
Disability Age Over 75 Correlation Summary
| Measurement | Haitian | British West Indian |
| Minimum | 17.4% | 20.3% |
| Maximum | 71.4% | 73.0% |
| Range | 54.0% | 52.8% |
| Mean | 47.4% | 48.4% |
| Median | 47.1% | 48.9% |
| Interquartile 25% (IQ1) | 44.6% | 45.2% |
| Interquartile 75% (IQ3) | 49.8% | 52.8% |
| Interquartile Range (IQR) | 5.1% | 7.5% |
| Standard Deviation (Sample) | 7.5% | 8.6% |
| Standard Deviation (Population) | 7.4% | 8.6% |
Similar Demographics by Disability Age Over 75
Demographics Similar to Haitians by Disability Age Over 75
In terms of disability age over 75, the demographic groups most similar to Haitians are Ecuadorian (47.4%, a difference of 0.050%), Cuban (47.4%, a difference of 0.060%), Sierra Leonean (47.4%, a difference of 0.070%), Immigrants from Ecuador (47.4%, a difference of 0.070%), and Immigrants from Kazakhstan (47.4%, a difference of 0.10%).
| Demographics | Rating | Rank | Disability Age Over 75 |
| German Russians | 56.2 /100 | #170 | Average 47.3% |
| Immigrants | Africa | 53.6 /100 | #171 | Average 47.3% |
| Scotch-Irish | 52.5 /100 | #172 | Average 47.3% |
| Alsatians | 51.9 /100 | #173 | Average 47.3% |
| Whites/Caucasians | 50.0 /100 | #174 | Average 47.3% |
| Immigrants | Haiti | 49.7 /100 | #175 | Average 47.3% |
| Ecuadorians | 46.7 /100 | #176 | Average 47.4% |
| Haitians | 44.6 /100 | #177 | Average 47.4% |
| Cubans | 42.1 /100 | #178 | Average 47.4% |
| Sierra Leoneans | 41.7 /100 | #179 | Average 47.4% |
| Immigrants | Ecuador | 41.7 /100 | #180 | Average 47.4% |
| Immigrants | Kazakhstan | 40.4 /100 | #181 | Average 47.4% |
| Immigrants | Moldova | 39.9 /100 | #182 | Fair 47.4% |
| Delaware | 39.1 /100 | #183 | Fair 47.5% |
| Immigrants | Nigeria | 34.0 /100 | #184 | Fair 47.5% |
Demographics Similar to British West Indians by Disability Age Over 75
In terms of disability age over 75, the demographic groups most similar to British West Indians are Immigrants from Vietnam (48.7%, a difference of 0.030%), Immigrants from South Eastern Asia (48.7%, a difference of 0.040%), Chinese (48.7%, a difference of 0.070%), Immigrants from Congo (48.7%, a difference of 0.080%), and Blackfeet (48.8%, a difference of 0.14%).
| Demographics | Rating | Rank | Disability Age Over 75 |
| Chippewa | 1.6 /100 | #246 | Tragic 48.4% |
| Iroquois | 1.6 /100 | #247 | Tragic 48.4% |
| Sri Lankans | 1.4 /100 | #248 | Tragic 48.5% |
| Iraqis | 1.0 /100 | #249 | Tragic 48.6% |
| West Indians | 0.8 /100 | #250 | Tragic 48.6% |
| Koreans | 0.8 /100 | #251 | Tragic 48.6% |
| Immigrants | South Eastern Asia | 0.7 /100 | #252 | Tragic 48.7% |
| British West Indians | 0.6 /100 | #253 | Tragic 48.7% |
| Immigrants | Vietnam | 0.6 /100 | #254 | Tragic 48.7% |
| Chinese | 0.5 /100 | #255 | Tragic 48.7% |
| Immigrants | Congo | 0.5 /100 | #256 | Tragic 48.7% |
| Blackfeet | 0.5 /100 | #257 | Tragic 48.8% |
| Immigrants | Philippines | 0.4 /100 | #258 | Tragic 48.8% |
| Central Americans | 0.4 /100 | #259 | Tragic 48.8% |
| Immigrants | Afghanistan | 0.4 /100 | #260 | Tragic 48.8% |