French Canadian vs English Disability Age Over 75
COMPARE
French Canadian
English
Disability Age Over 75
Disability Age Over 75 Comparison
French Canadians
English
47.0%
DISABILITY AGE OVER 75
79.0/ 100
METRIC RATING
151st/ 347
METRIC RANK
46.8%
DISABILITY AGE OVER 75
89.4/ 100
METRIC RATING
133rd/ 347
METRIC RANK
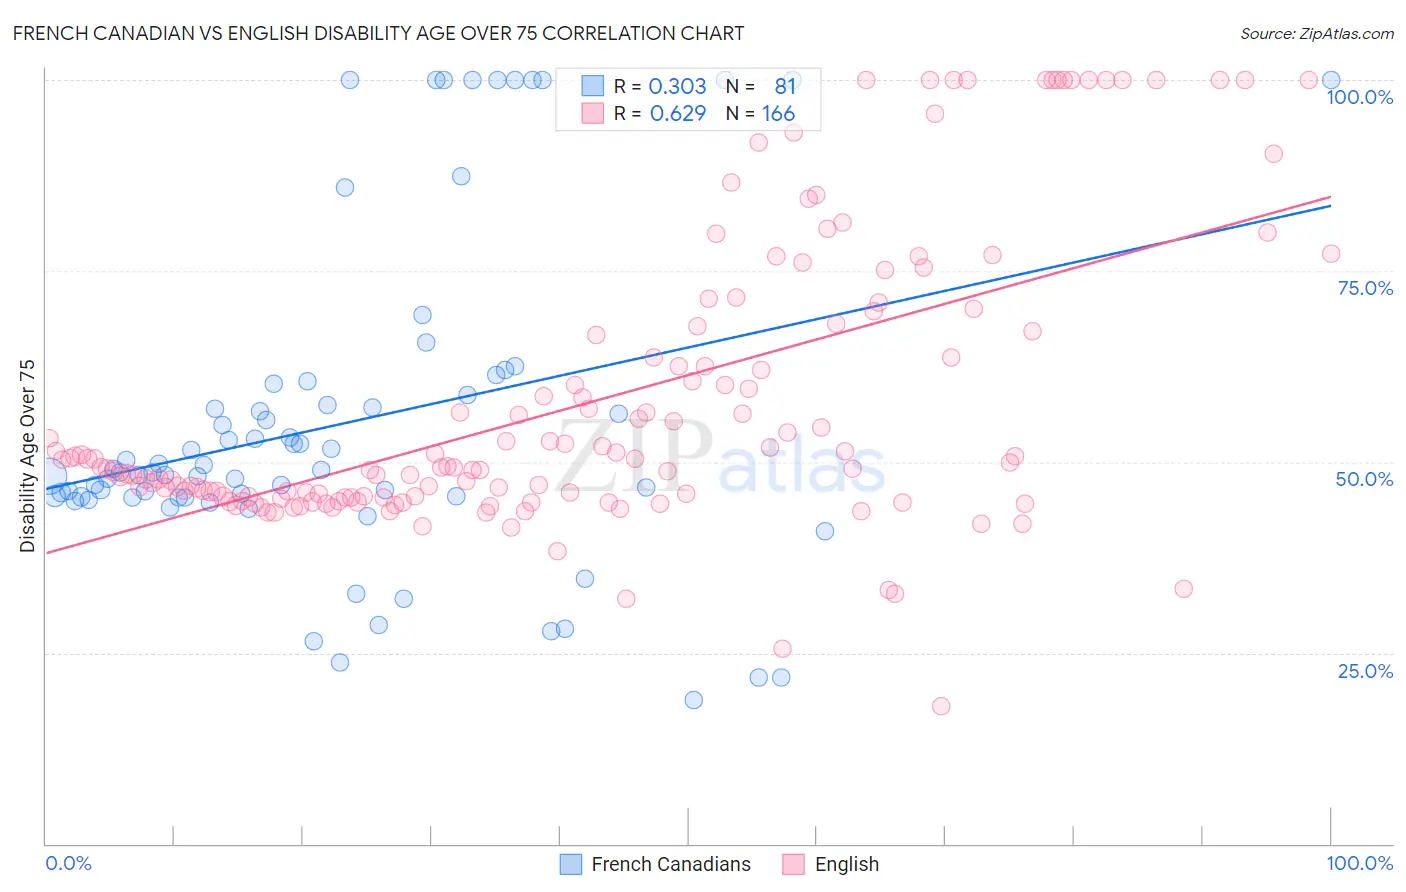
French Canadian vs English Disability Age Over 75 Correlation Chart
The statistical analysis conducted on geographies consisting of 501,362,781 people shows a mild positive correlation between the proportion of French Canadians and percentage of population with a disability over the age of 75 in the United States with a correlation coefficient (R) of 0.303 and weighted average of 47.0%. Similarly, the statistical analysis conducted on geographies consisting of 577,173,865 people shows a significant positive correlation between the proportion of English and percentage of population with a disability over the age of 75 in the United States with a correlation coefficient (R) of 0.629 and weighted average of 46.8%, a difference of 0.46%.
Disability Age Over 75 Correlation Summary
| Measurement | French Canadian | English |
| Minimum | 18.8% | 17.9% |
| Maximum | 100.0% | 100.0% |
| Range | 81.2% | 82.1% |
| Mean | 55.1% | 57.8% |
| Median | 48.7% | 49.4% |
| Interquartile 25% (IQ1) | 45.4% | 45.4% |
| Interquartile 75% (IQ3) | 59.5% | 67.1% |
| Interquartile Range (IQR) | 14.1% | 21.8% |
| Standard Deviation (Sample) | 21.3% | 18.9% |
| Standard Deviation (Population) | 21.2% | 18.9% |
Demographics Similar to French Canadians and English by Disability Age Over 75
In terms of disability age over 75, the demographic groups most similar to French Canadians are Immigrants from Russia (47.0%, a difference of 0.010%), Welsh (47.0%, a difference of 0.080%), Immigrants from Asia (47.0%, a difference of 0.080%), Asian (46.9%, a difference of 0.090%), and Immigrants from Peru (46.9%, a difference of 0.19%). Similarly, the demographic groups most similar to English are Immigrants from Ethiopia (46.8%, a difference of 0.020%), Ethiopian (46.8%, a difference of 0.030%), South American (46.8%, a difference of 0.040%), Immigrants from Venezuela (46.8%, a difference of 0.040%), and Immigrants from Uganda (46.8%, a difference of 0.050%).
| Demographics | Rating | Rank | Disability Age Over 75 |
| South Americans | 90.0 /100 | #132 | Excellent 46.8% |
| English | 89.4 /100 | #133 | Excellent 46.8% |
| Immigrants | Ethiopia | 89.1 /100 | #134 | Excellent 46.8% |
| Ethiopians | 88.9 /100 | #135 | Excellent 46.8% |
| Immigrants | Venezuela | 88.6 /100 | #136 | Excellent 46.8% |
| Immigrants | Uganda | 88.5 /100 | #137 | Excellent 46.8% |
| Immigrants | Bosnia and Herzegovina | 88.5 /100 | #138 | Excellent 46.8% |
| Yugoslavians | 88.5 /100 | #139 | Excellent 46.8% |
| Immigrants | Costa Rica | 87.4 /100 | #140 | Excellent 46.8% |
| Lebanese | 87.0 /100 | #141 | Excellent 46.8% |
| Peruvians | 86.5 /100 | #142 | Excellent 46.8% |
| Bermudans | 85.6 /100 | #143 | Excellent 46.9% |
| Venezuelans | 85.0 /100 | #144 | Excellent 46.9% |
| Costa Ricans | 84.5 /100 | #145 | Excellent 46.9% |
| Guyanese | 84.3 /100 | #146 | Excellent 46.9% |
| Immigrants | Peru | 84.1 /100 | #147 | Excellent 46.9% |
| Asians | 81.6 /100 | #148 | Excellent 46.9% |
| Welsh | 81.3 /100 | #149 | Excellent 47.0% |
| Immigrants | Russia | 79.3 /100 | #150 | Good 47.0% |
| French Canadians | 79.0 /100 | #151 | Good 47.0% |
| Immigrants | Asia | 76.5 /100 | #152 | Good 47.0% |