Yugoslavian vs English Disability Age Over 75
COMPARE
Yugoslavian
English
Disability Age Over 75
Disability Age Over 75 Comparison
Yugoslavians
English
46.8%
DISABILITY AGE OVER 75
88.5/ 100
METRIC RATING
139th/ 347
METRIC RANK
46.8%
DISABILITY AGE OVER 75
89.4/ 100
METRIC RATING
133rd/ 347
METRIC RANK
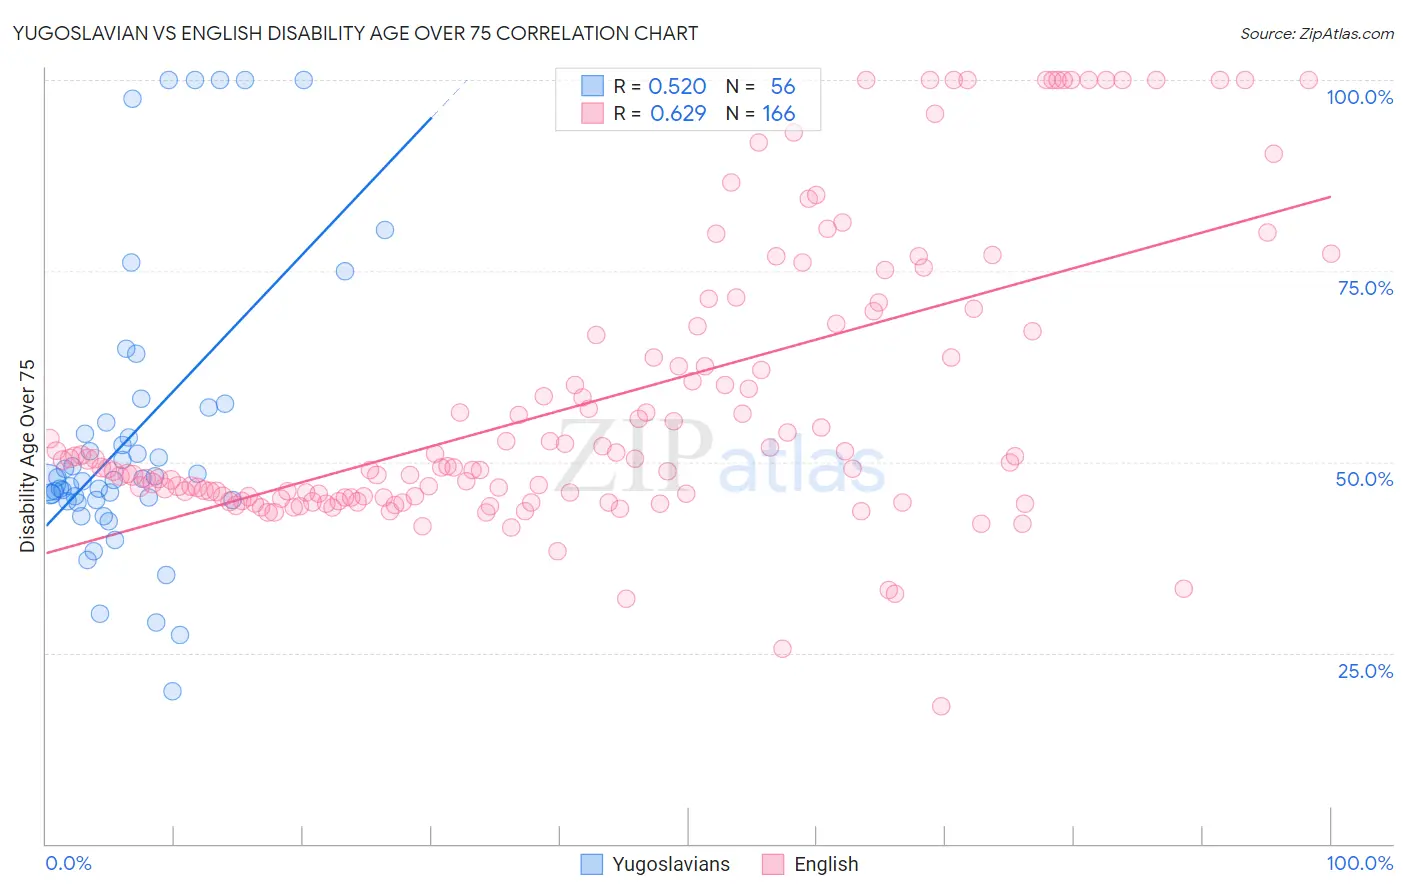
Yugoslavian vs English Disability Age Over 75 Correlation Chart
The statistical analysis conducted on geographies consisting of 285,458,970 people shows a substantial positive correlation between the proportion of Yugoslavians and percentage of population with a disability over the age of 75 in the United States with a correlation coefficient (R) of 0.520 and weighted average of 46.8%. Similarly, the statistical analysis conducted on geographies consisting of 577,173,865 people shows a significant positive correlation between the proportion of English and percentage of population with a disability over the age of 75 in the United States with a correlation coefficient (R) of 0.629 and weighted average of 46.8%, a difference of 0.050%.
Disability Age Over 75 Correlation Summary
| Measurement | Yugoslavian | English |
| Minimum | 20.0% | 17.9% |
| Maximum | 100.0% | 100.0% |
| Range | 80.0% | 82.1% |
| Mean | 53.7% | 57.8% |
| Median | 47.8% | 49.4% |
| Interquartile 25% (IQ1) | 45.0% | 45.4% |
| Interquartile 75% (IQ3) | 56.1% | 67.1% |
| Interquartile Range (IQR) | 11.1% | 21.8% |
| Standard Deviation (Sample) | 19.2% | 18.9% |
| Standard Deviation (Population) | 19.0% | 18.9% |
Demographics Similar to Yugoslavians and English by Disability Age Over 75
In terms of disability age over 75, the demographic groups most similar to Yugoslavians are Immigrants from Bosnia and Herzegovina (46.8%, a difference of 0.0%), Immigrants from Venezuela (46.8%, a difference of 0.010%), Immigrants from Uganda (46.8%, a difference of 0.010%), Ethiopian (46.8%, a difference of 0.020%), and Immigrants from Ethiopia (46.8%, a difference of 0.040%). Similarly, the demographic groups most similar to English are Immigrants from Ethiopia (46.8%, a difference of 0.020%), Ethiopian (46.8%, a difference of 0.030%), South American (46.8%, a difference of 0.040%), Immigrants from Venezuela (46.8%, a difference of 0.040%), and Immigrants from Uganda (46.8%, a difference of 0.050%).
| Demographics | Rating | Rank | Disability Age Over 75 |
| Europeans | 91.2 /100 | #126 | Exceptional 46.7% |
| Syrians | 91.1 /100 | #127 | Exceptional 46.7% |
| Icelanders | 90.9 /100 | #128 | Exceptional 46.7% |
| Immigrants | Germany | 90.8 /100 | #129 | Exceptional 46.7% |
| Immigrants | Northern Africa | 90.7 /100 | #130 | Exceptional 46.7% |
| Scottish | 90.5 /100 | #131 | Exceptional 46.7% |
| South Americans | 90.0 /100 | #132 | Excellent 46.8% |
| English | 89.4 /100 | #133 | Excellent 46.8% |
| Immigrants | Ethiopia | 89.1 /100 | #134 | Excellent 46.8% |
| Ethiopians | 88.9 /100 | #135 | Excellent 46.8% |
| Immigrants | Venezuela | 88.6 /100 | #136 | Excellent 46.8% |
| Immigrants | Uganda | 88.5 /100 | #137 | Excellent 46.8% |
| Immigrants | Bosnia and Herzegovina | 88.5 /100 | #138 | Excellent 46.8% |
| Yugoslavians | 88.5 /100 | #139 | Excellent 46.8% |
| Immigrants | Costa Rica | 87.4 /100 | #140 | Excellent 46.8% |
| Lebanese | 87.0 /100 | #141 | Excellent 46.8% |
| Peruvians | 86.5 /100 | #142 | Excellent 46.8% |
| Bermudans | 85.6 /100 | #143 | Excellent 46.9% |
| Venezuelans | 85.0 /100 | #144 | Excellent 46.9% |
| Costa Ricans | 84.5 /100 | #145 | Excellent 46.9% |
| Guyanese | 84.3 /100 | #146 | Excellent 46.9% |