French Canadian vs Cambodian Disability Age Over 75
COMPARE
French Canadian
Cambodian
Disability Age Over 75
Disability Age Over 75 Comparison
French Canadians
Cambodians
47.0%
DISABILITY AGE OVER 75
79.0/ 100
METRIC RATING
151st/ 347
METRIC RANK
46.1%
DISABILITY AGE OVER 75
99.1/ 100
METRIC RATING
73rd/ 347
METRIC RANK
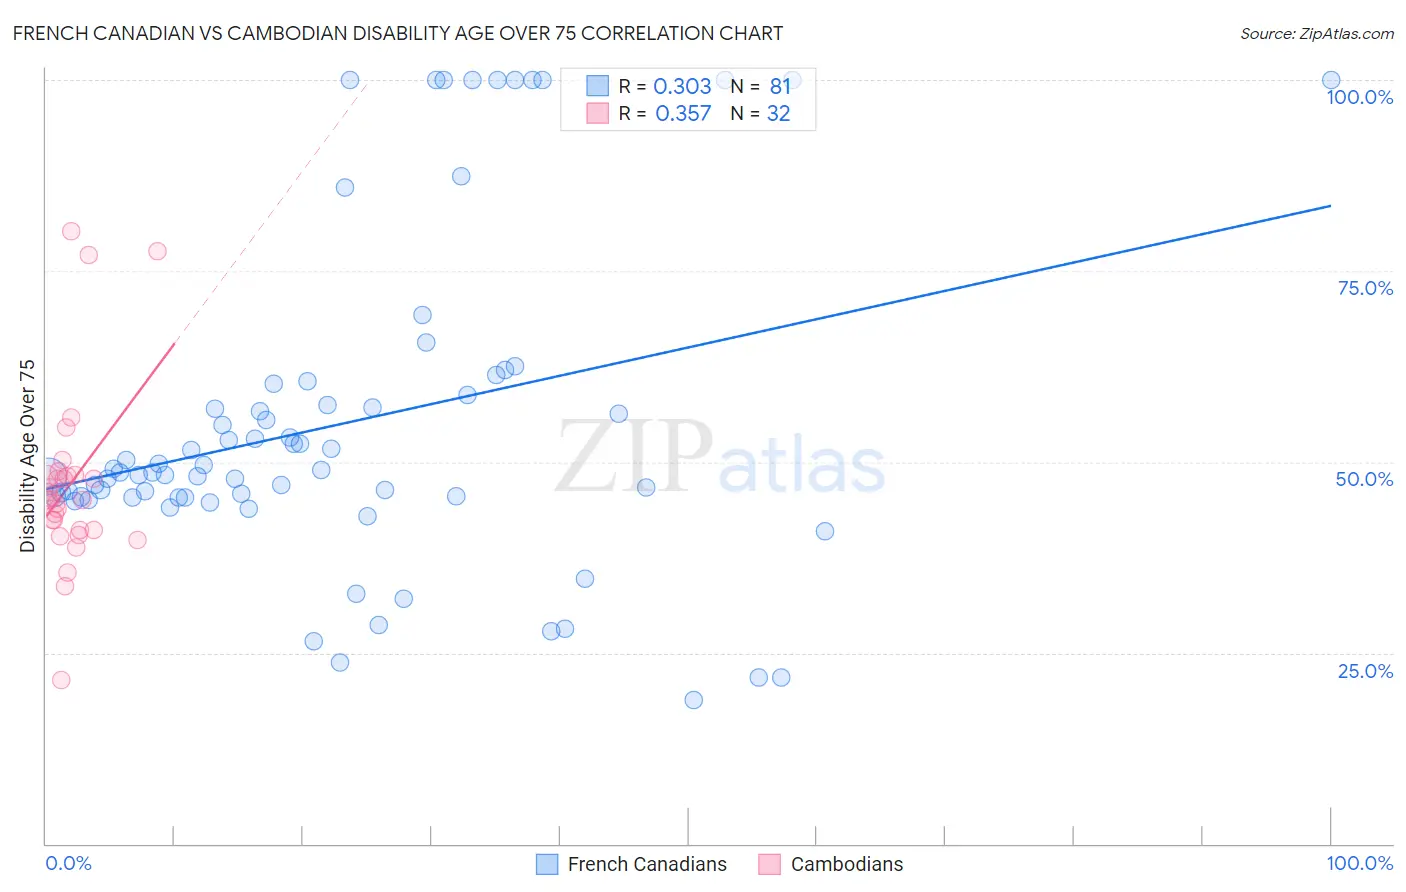
French Canadian vs Cambodian Disability Age Over 75 Correlation Chart
The statistical analysis conducted on geographies consisting of 501,362,781 people shows a mild positive correlation between the proportion of French Canadians and percentage of population with a disability over the age of 75 in the United States with a correlation coefficient (R) of 0.303 and weighted average of 47.0%. Similarly, the statistical analysis conducted on geographies consisting of 102,426,643 people shows a mild positive correlation between the proportion of Cambodians and percentage of population with a disability over the age of 75 in the United States with a correlation coefficient (R) of 0.357 and weighted average of 46.1%, a difference of 1.9%.
Disability Age Over 75 Correlation Summary
| Measurement | French Canadian | Cambodian |
| Minimum | 18.8% | 21.4% |
| Maximum | 100.0% | 80.2% |
| Range | 81.2% | 58.8% |
| Mean | 55.1% | 47.1% |
| Median | 48.7% | 45.1% |
| Interquartile 25% (IQ1) | 45.4% | 41.1% |
| Interquartile 75% (IQ3) | 59.5% | 48.2% |
| Interquartile Range (IQR) | 14.1% | 7.2% |
| Standard Deviation (Sample) | 21.3% | 12.0% |
| Standard Deviation (Population) | 21.2% | 11.8% |
Similar Demographics by Disability Age Over 75
Demographics Similar to French Canadians by Disability Age Over 75
In terms of disability age over 75, the demographic groups most similar to French Canadians are Immigrants from Russia (47.0%, a difference of 0.010%), Welsh (47.0%, a difference of 0.080%), Immigrants from Asia (47.0%, a difference of 0.080%), Asian (46.9%, a difference of 0.090%), and Immigrants from Zaire (47.1%, a difference of 0.13%).
| Demographics | Rating | Rank | Disability Age Over 75 |
| Venezuelans | 85.0 /100 | #144 | Excellent 46.9% |
| Costa Ricans | 84.5 /100 | #145 | Excellent 46.9% |
| Guyanese | 84.3 /100 | #146 | Excellent 46.9% |
| Immigrants | Peru | 84.1 /100 | #147 | Excellent 46.9% |
| Asians | 81.6 /100 | #148 | Excellent 46.9% |
| Welsh | 81.3 /100 | #149 | Excellent 47.0% |
| Immigrants | Russia | 79.3 /100 | #150 | Good 47.0% |
| French Canadians | 79.0 /100 | #151 | Good 47.0% |
| Immigrants | Asia | 76.5 /100 | #152 | Good 47.0% |
| Immigrants | Zaire | 74.8 /100 | #153 | Good 47.1% |
| Immigrants | Belarus | 74.8 /100 | #154 | Good 47.1% |
| Immigrants | Iran | 74.7 /100 | #155 | Good 47.1% |
| Arabs | 73.3 /100 | #156 | Good 47.1% |
| Bhutanese | 72.6 /100 | #157 | Good 47.1% |
| Immigrants | Guyana | 71.9 /100 | #158 | Good 47.1% |
Demographics Similar to Cambodians by Disability Age Over 75
In terms of disability age over 75, the demographic groups most similar to Cambodians are Immigrants from Hungary (46.1%, a difference of 0.020%), Egyptian (46.1%, a difference of 0.040%), Immigrants from Sri Lanka (46.1%, a difference of 0.050%), Jordanian (46.1%, a difference of 0.080%), and Serbian (46.1%, a difference of 0.080%).
| Demographics | Rating | Rank | Disability Age Over 75 |
| Immigrants | England | 99.5 /100 | #66 | Exceptional 46.0% |
| Immigrants | Spain | 99.4 /100 | #67 | Exceptional 46.0% |
| Immigrants | South Central Asia | 99.4 /100 | #68 | Exceptional 46.0% |
| Immigrants | Romania | 99.3 /100 | #69 | Exceptional 46.0% |
| Jordanians | 99.2 /100 | #70 | Exceptional 46.1% |
| Immigrants | Sri Lanka | 99.2 /100 | #71 | Exceptional 46.1% |
| Immigrants | Hungary | 99.1 /100 | #72 | Exceptional 46.1% |
| Cambodians | 99.1 /100 | #73 | Exceptional 46.1% |
| Egyptians | 99.0 /100 | #74 | Exceptional 46.1% |
| Serbians | 99.0 /100 | #75 | Exceptional 46.1% |
| Slavs | 98.9 /100 | #76 | Exceptional 46.1% |
| Immigrants | Eastern Asia | 98.9 /100 | #77 | Exceptional 46.2% |
| Immigrants | Western Europe | 98.8 /100 | #78 | Exceptional 46.2% |
| Swiss | 98.8 /100 | #79 | Exceptional 46.2% |
| Soviet Union | 98.8 /100 | #80 | Exceptional 46.2% |