French Canadian vs Arapaho Disability Age Over 75
COMPARE
French Canadian
Arapaho
Disability Age Over 75
Disability Age Over 75 Comparison
French Canadians
Arapaho
47.0%
DISABILITY AGE OVER 75
79.0/ 100
METRIC RATING
151st/ 347
METRIC RANK
49.8%
DISABILITY AGE OVER 75
0.0/ 100
METRIC RATING
291st/ 347
METRIC RANK
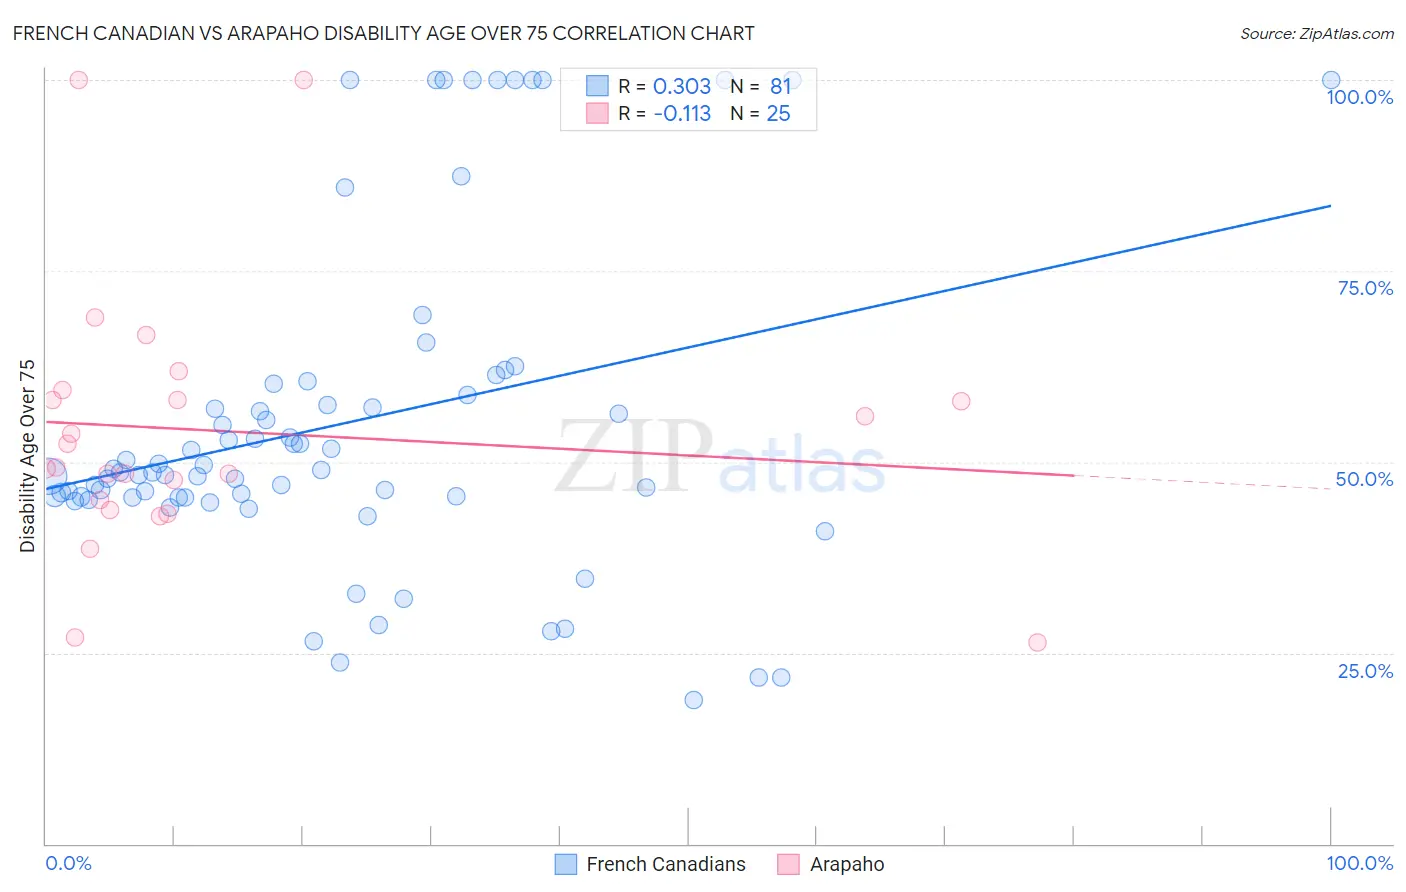
French Canadian vs Arapaho Disability Age Over 75 Correlation Chart
The statistical analysis conducted on geographies consisting of 501,362,781 people shows a mild positive correlation between the proportion of French Canadians and percentage of population with a disability over the age of 75 in the United States with a correlation coefficient (R) of 0.303 and weighted average of 47.0%. Similarly, the statistical analysis conducted on geographies consisting of 29,767,019 people shows a poor negative correlation between the proportion of Arapaho and percentage of population with a disability over the age of 75 in the United States with a correlation coefficient (R) of -0.113 and weighted average of 49.8%, a difference of 6.0%.
Disability Age Over 75 Correlation Summary
| Measurement | French Canadian | Arapaho |
| Minimum | 18.8% | 26.3% |
| Maximum | 100.0% | 100.0% |
| Range | 81.2% | 73.7% |
| Mean | 55.1% | 54.0% |
| Median | 48.7% | 49.3% |
| Interquartile 25% (IQ1) | 45.4% | 44.4% |
| Interquartile 75% (IQ3) | 59.5% | 58.7% |
| Interquartile Range (IQR) | 14.1% | 14.4% |
| Standard Deviation (Sample) | 21.3% | 17.2% |
| Standard Deviation (Population) | 21.2% | 16.9% |
Similar Demographics by Disability Age Over 75
Demographics Similar to French Canadians by Disability Age Over 75
In terms of disability age over 75, the demographic groups most similar to French Canadians are Immigrants from Russia (47.0%, a difference of 0.010%), Welsh (47.0%, a difference of 0.080%), Immigrants from Asia (47.0%, a difference of 0.080%), Asian (46.9%, a difference of 0.090%), and Immigrants from Zaire (47.1%, a difference of 0.13%).
| Demographics | Rating | Rank | Disability Age Over 75 |
| Venezuelans | 85.0 /100 | #144 | Excellent 46.9% |
| Costa Ricans | 84.5 /100 | #145 | Excellent 46.9% |
| Guyanese | 84.3 /100 | #146 | Excellent 46.9% |
| Immigrants | Peru | 84.1 /100 | #147 | Excellent 46.9% |
| Asians | 81.6 /100 | #148 | Excellent 46.9% |
| Welsh | 81.3 /100 | #149 | Excellent 47.0% |
| Immigrants | Russia | 79.3 /100 | #150 | Good 47.0% |
| French Canadians | 79.0 /100 | #151 | Good 47.0% |
| Immigrants | Asia | 76.5 /100 | #152 | Good 47.0% |
| Immigrants | Zaire | 74.8 /100 | #153 | Good 47.1% |
| Immigrants | Belarus | 74.8 /100 | #154 | Good 47.1% |
| Immigrants | Iran | 74.7 /100 | #155 | Good 47.1% |
| Arabs | 73.3 /100 | #156 | Good 47.1% |
| Bhutanese | 72.6 /100 | #157 | Good 47.1% |
| Immigrants | Guyana | 71.9 /100 | #158 | Good 47.1% |
Demographics Similar to Arapaho by Disability Age Over 75
In terms of disability age over 75, the demographic groups most similar to Arapaho are Puget Sound Salish (49.8%, a difference of 0.0%), Osage (49.8%, a difference of 0.020%), Shoshone (49.9%, a difference of 0.070%), Yaqui (49.8%, a difference of 0.090%), and Sioux (49.7%, a difference of 0.14%).
| Demographics | Rating | Rank | Disability Age Over 75 |
| Immigrants | Latin America | 0.0 /100 | #284 | Tragic 49.5% |
| Crow | 0.0 /100 | #285 | Tragic 49.6% |
| Immigrants | Belize | 0.0 /100 | #286 | Tragic 49.6% |
| Sioux | 0.0 /100 | #287 | Tragic 49.7% |
| Yaqui | 0.0 /100 | #288 | Tragic 49.8% |
| Osage | 0.0 /100 | #289 | Tragic 49.8% |
| Puget Sound Salish | 0.0 /100 | #290 | Tragic 49.8% |
| Arapaho | 0.0 /100 | #291 | Tragic 49.8% |
| Shoshone | 0.0 /100 | #292 | Tragic 49.9% |
| Spanish American Indians | 0.0 /100 | #293 | Tragic 49.9% |
| Immigrants | Cambodia | 0.0 /100 | #294 | Tragic 50.0% |
| Spanish Americans | 0.0 /100 | #295 | Tragic 50.0% |
| Mexican American Indians | 0.0 /100 | #296 | Tragic 50.0% |
| Armenians | 0.0 /100 | #297 | Tragic 50.0% |
| Marshallese | 0.0 /100 | #298 | Tragic 50.1% |