French Canadian vs Arapaho Receiving Food Stamps
COMPARE
French Canadian
Arapaho
Receiving Food Stamps
Receiving Food Stamps Comparison
French Canadians
Arapaho
11.4%
RECEIVING FOOD STAMPS
69.5/ 100
METRIC RATING
160th/ 347
METRIC RANK
14.1%
RECEIVING FOOD STAMPS
0.3/ 100
METRIC RATING
257th/ 347
METRIC RANK
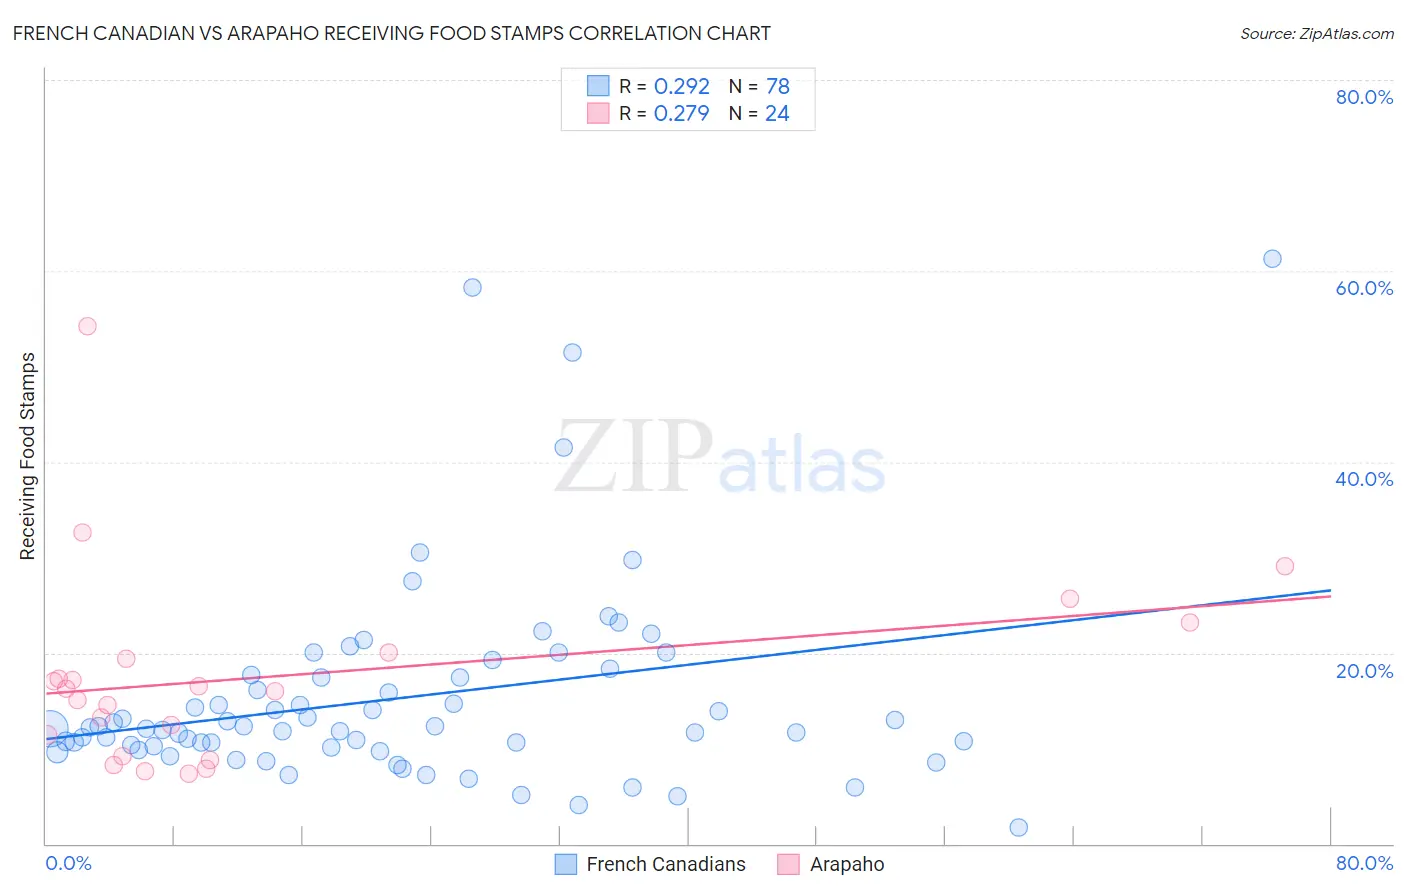
French Canadian vs Arapaho Receiving Food Stamps Correlation Chart
The statistical analysis conducted on geographies consisting of 500,490,947 people shows a weak positive correlation between the proportion of French Canadians and percentage of population receiving government assistance and/or food stamps in the United States with a correlation coefficient (R) of 0.292 and weighted average of 11.4%. Similarly, the statistical analysis conducted on geographies consisting of 29,772,376 people shows a weak positive correlation between the proportion of Arapaho and percentage of population receiving government assistance and/or food stamps in the United States with a correlation coefficient (R) of 0.279 and weighted average of 14.1%, a difference of 23.7%.
Receiving Food Stamps Correlation Summary
| Measurement | French Canadian | Arapaho |
| Minimum | 1.7% | 7.3% |
| Maximum | 61.3% | 54.2% |
| Range | 59.6% | 46.9% |
| Mean | 15.3% | 17.5% |
| Median | 12.1% | 16.1% |
| Interquartile 25% (IQ1) | 10.2% | 10.2% |
| Interquartile 75% (IQ3) | 17.4% | 19.7% |
| Interquartile Range (IQR) | 7.3% | 9.4% |
| Standard Deviation (Sample) | 10.6% | 10.3% |
| Standard Deviation (Population) | 10.5% | 10.1% |
Similar Demographics by Receiving Food Stamps
Demographics Similar to French Canadians by Receiving Food Stamps
In terms of receiving food stamps, the demographic groups most similar to French Canadians are Immigrants from Oceania (11.4%, a difference of 0.16%), Pennsylvania German (11.4%, a difference of 0.18%), Alsatian (11.4%, a difference of 0.25%), Immigrants from Bosnia and Herzegovina (11.3%, a difference of 0.55%), and Immigrants from Southern Europe (11.5%, a difference of 0.61%).
| Demographics | Rating | Rank | Receiving Food Stamps |
| Lebanese | 81.6 /100 | #153 | Excellent 11.1% |
| Armenians | 81.4 /100 | #154 | Excellent 11.1% |
| Immigrants | Argentina | 80.4 /100 | #155 | Excellent 11.2% |
| Immigrants | Afghanistan | 75.6 /100 | #156 | Good 11.3% |
| Immigrants | Lebanon | 75.2 /100 | #157 | Good 11.3% |
| Immigrants | Bosnia and Herzegovina | 72.6 /100 | #158 | Good 11.3% |
| Immigrants | Oceania | 70.4 /100 | #159 | Good 11.4% |
| French Canadians | 69.5 /100 | #160 | Good 11.4% |
| Pennsylvania Germans | 68.4 /100 | #161 | Good 11.4% |
| Alsatians | 68.0 /100 | #162 | Good 11.4% |
| Immigrants | Southern Europe | 65.8 /100 | #163 | Good 11.5% |
| Immigrants | Chile | 65.0 /100 | #164 | Good 11.5% |
| Arabs | 64.7 /100 | #165 | Good 11.5% |
| Immigrants | Belarus | 62.8 /100 | #166 | Good 11.5% |
| Kenyans | 60.2 /100 | #167 | Good 11.6% |
Demographics Similar to Arapaho by Receiving Food Stamps
In terms of receiving food stamps, the demographic groups most similar to Arapaho are Immigrants from Ghana (14.1%, a difference of 0.080%), Japanese (14.1%, a difference of 0.10%), Subsaharan African (14.1%, a difference of 0.12%), Marshallese (14.1%, a difference of 0.14%), and Creek (14.1%, a difference of 0.20%).
| Demographics | Rating | Rank | Receiving Food Stamps |
| Immigrants | Cambodia | 0.5 /100 | #250 | Tragic 13.9% |
| Yaqui | 0.5 /100 | #251 | Tragic 13.9% |
| Ghanaians | 0.5 /100 | #252 | Tragic 14.0% |
| Spanish Americans | 0.4 /100 | #253 | Tragic 14.0% |
| Marshallese | 0.3 /100 | #254 | Tragic 14.1% |
| Sub-Saharan Africans | 0.3 /100 | #255 | Tragic 14.1% |
| Japanese | 0.3 /100 | #256 | Tragic 14.1% |
| Arapaho | 0.3 /100 | #257 | Tragic 14.1% |
| Immigrants | Ghana | 0.3 /100 | #258 | Tragic 14.1% |
| Creek | 0.3 /100 | #259 | Tragic 14.1% |
| Central Americans | 0.3 /100 | #260 | Tragic 14.1% |
| Immigrants | Congo | 0.3 /100 | #261 | Tragic 14.1% |
| Paiute | 0.2 /100 | #262 | Tragic 14.3% |
| Immigrants | Portugal | 0.2 /100 | #263 | Tragic 14.3% |
| Immigrants | Uzbekistan | 0.2 /100 | #264 | Tragic 14.3% |