Immigrants from Micronesia vs Immigrants from Belize Cognitive Disability
COMPARE
Immigrants from Micronesia
Immigrants from Belize
Cognitive Disability
Cognitive Disability Comparison
Immigrants from Micronesia
Immigrants from Belize
18.1%
COGNITIVE DISABILITY
0.2/ 100
METRIC RATING
278th/ 347
METRIC RANK
17.9%
COGNITIVE DISABILITY
0.5/ 100
METRIC RATING
260th/ 347
METRIC RANK
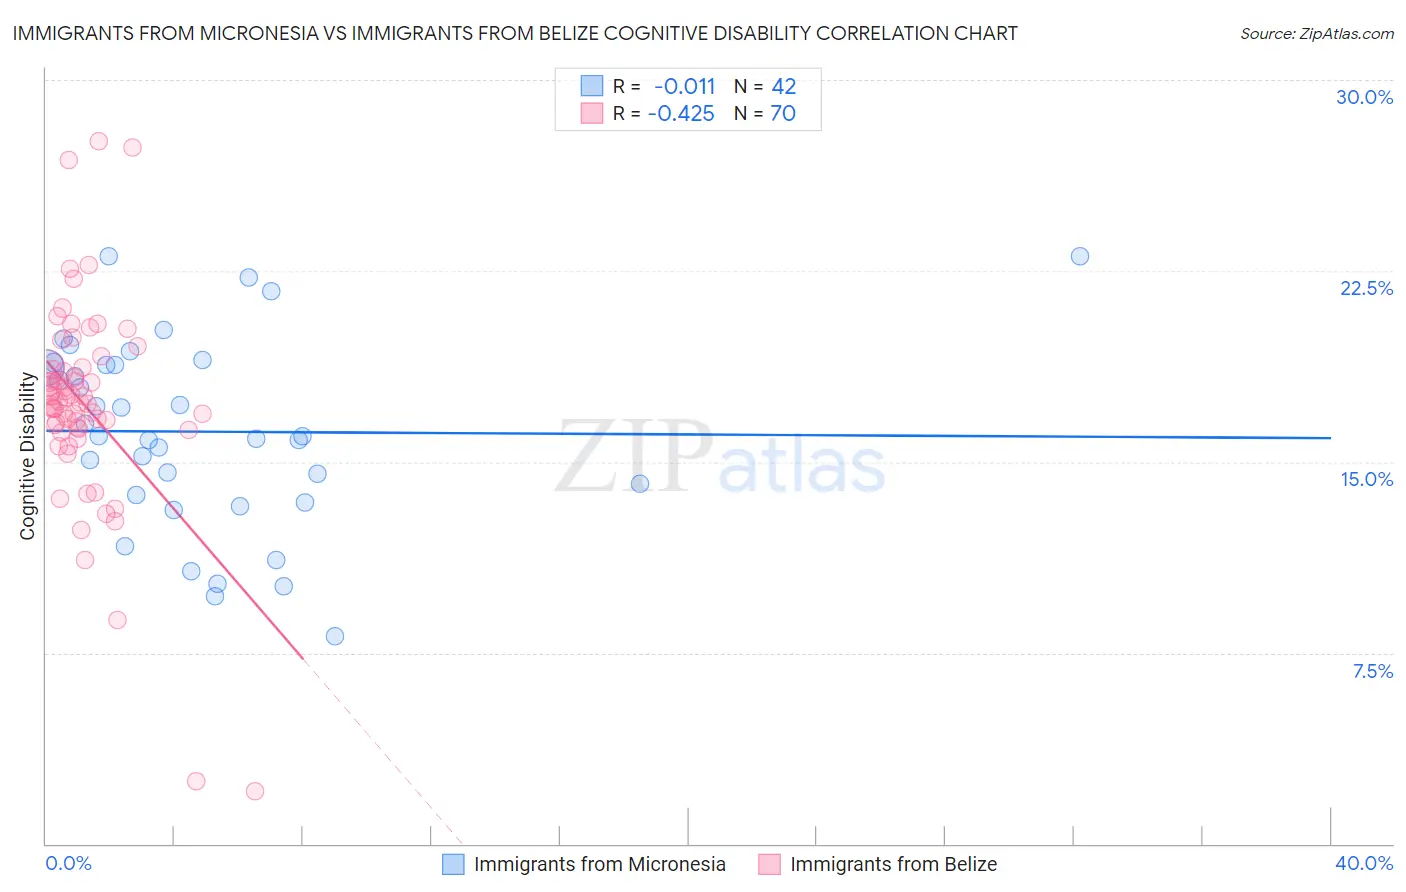
Immigrants from Micronesia vs Immigrants from Belize Cognitive Disability Correlation Chart
The statistical analysis conducted on geographies consisting of 61,603,104 people shows no correlation between the proportion of Immigrants from Micronesia and percentage of population with cognitive disability in the United States with a correlation coefficient (R) of -0.011 and weighted average of 18.1%. Similarly, the statistical analysis conducted on geographies consisting of 130,294,835 people shows a moderate negative correlation between the proportion of Immigrants from Belize and percentage of population with cognitive disability in the United States with a correlation coefficient (R) of -0.425 and weighted average of 17.9%, a difference of 0.81%.
Cognitive Disability Correlation Summary
| Measurement | Immigrants from Micronesia | Immigrants from Belize |
| Minimum | 8.2% | 2.1% |
| Maximum | 23.1% | 27.6% |
| Range | 14.9% | 25.5% |
| Mean | 16.2% | 17.3% |
| Median | 16.0% | 17.3% |
| Interquartile 25% (IQ1) | 13.7% | 16.3% |
| Interquartile 75% (IQ3) | 18.8% | 18.7% |
| Interquartile Range (IQR) | 5.1% | 2.4% |
| Standard Deviation (Sample) | 3.7% | 4.1% |
| Standard Deviation (Population) | 3.7% | 4.1% |
Demographics Similar to Immigrants from Micronesia and Immigrants from Belize by Cognitive Disability
In terms of cognitive disability, the demographic groups most similar to Immigrants from Micronesia are Yuman (18.1%, a difference of 0.010%), Immigrants from Kuwait (18.1%, a difference of 0.010%), Immigrants from Laos (18.1%, a difference of 0.050%), Chippewa (18.1%, a difference of 0.050%), and Immigrants from Nepal (18.0%, a difference of 0.16%). Similarly, the demographic groups most similar to Immigrants from Belize are Ethiopian (17.9%, a difference of 0.010%), Guamanian/Chamorro (17.9%, a difference of 0.050%), Sierra Leonean (17.9%, a difference of 0.080%), Immigrants from Barbados (17.9%, a difference of 0.12%), and Menominee (18.0%, a difference of 0.18%).
| Demographics | Rating | Rank | Cognitive Disability |
| Ethiopians | 0.5 /100 | #259 | Tragic 17.9% |
| Immigrants | Belize | 0.5 /100 | #260 | Tragic 17.9% |
| Guamanians/Chamorros | 0.5 /100 | #261 | Tragic 17.9% |
| Sierra Leoneans | 0.4 /100 | #262 | Tragic 17.9% |
| Immigrants | Barbados | 0.4 /100 | #263 | Tragic 17.9% |
| Menominee | 0.4 /100 | #264 | Tragic 18.0% |
| Spanish Americans | 0.4 /100 | #265 | Tragic 18.0% |
| Belizeans | 0.4 /100 | #266 | Tragic 18.0% |
| Nepalese | 0.3 /100 | #267 | Tragic 18.0% |
| Cherokee | 0.3 /100 | #268 | Tragic 18.0% |
| Hondurans | 0.3 /100 | #269 | Tragic 18.0% |
| Immigrants | Bahamas | 0.3 /100 | #270 | Tragic 18.0% |
| Potawatomi | 0.2 /100 | #271 | Tragic 18.0% |
| Immigrants | Honduras | 0.2 /100 | #272 | Tragic 18.0% |
| Immigrants | Nepal | 0.2 /100 | #273 | Tragic 18.0% |
| Immigrants | Nigeria | 0.2 /100 | #274 | Tragic 18.0% |
| Immigrants | Laos | 0.2 /100 | #275 | Tragic 18.1% |
| Yuman | 0.2 /100 | #276 | Tragic 18.1% |
| Immigrants | Kuwait | 0.2 /100 | #277 | Tragic 18.1% |
| Immigrants | Micronesia | 0.2 /100 | #278 | Tragic 18.1% |
| Chippewa | 0.1 /100 | #279 | Tragic 18.1% |