Dominican vs Immigrants from Africa Vision Disability
COMPARE
Dominican
Immigrants from Africa
Vision Disability
Vision Disability Comparison
Dominicans
Immigrants from Africa
2.6%
VISION DISABILITY
0.0/ 100
METRIC RATING
311th/ 347
METRIC RANK
2.1%
VISION DISABILITY
62.6/ 100
METRIC RATING
167th/ 347
METRIC RANK
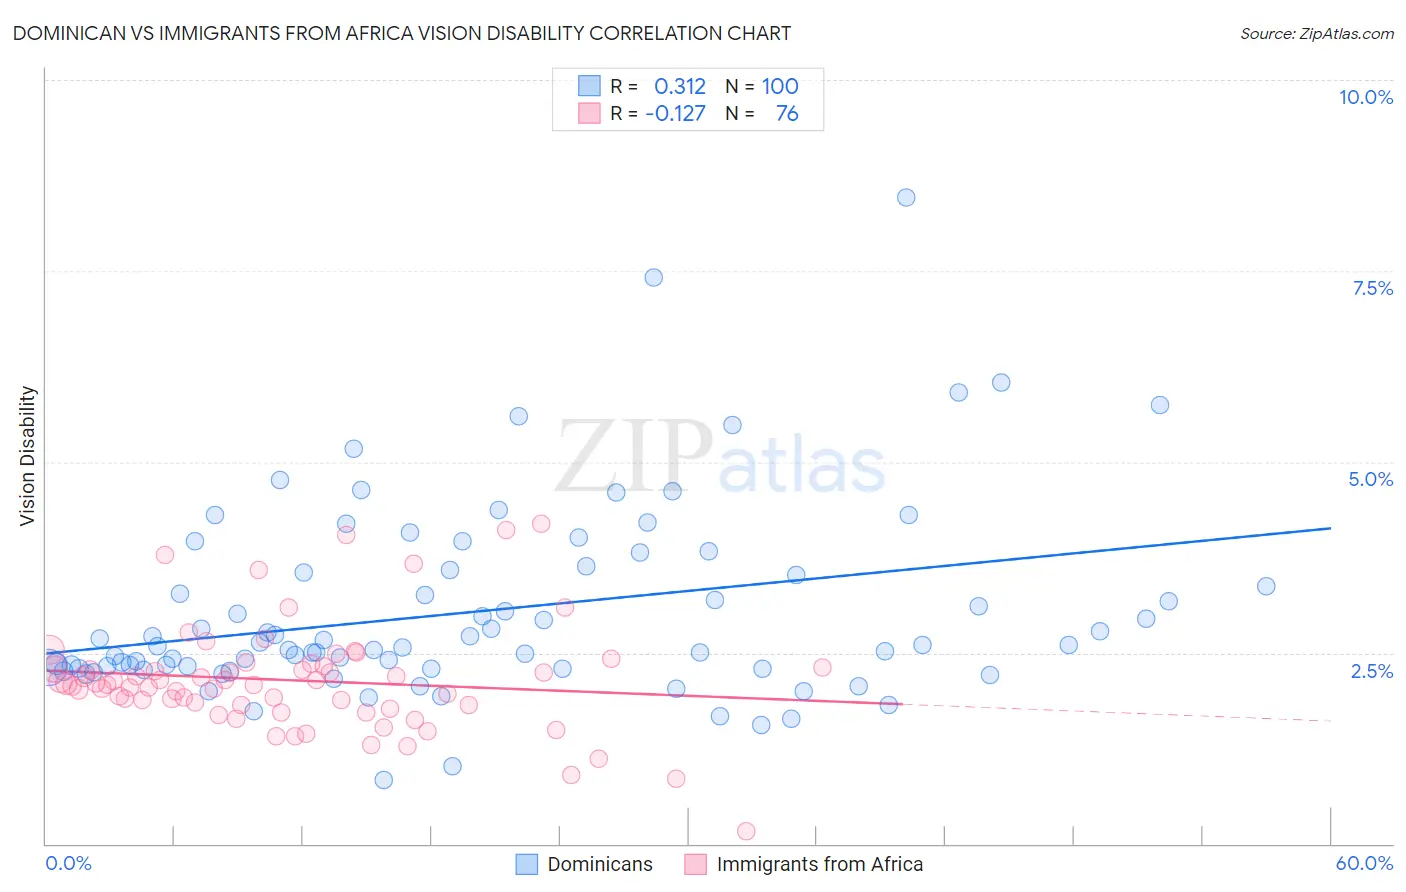
Dominican vs Immigrants from Africa Vision Disability Correlation Chart
The statistical analysis conducted on geographies consisting of 354,764,822 people shows a mild positive correlation between the proportion of Dominicans and percentage of population with vision disability in the United States with a correlation coefficient (R) of 0.312 and weighted average of 2.6%. Similarly, the statistical analysis conducted on geographies consisting of 468,780,270 people shows a poor negative correlation between the proportion of Immigrants from Africa and percentage of population with vision disability in the United States with a correlation coefficient (R) of -0.127 and weighted average of 2.1%, a difference of 22.2%.
Vision Disability Correlation Summary
| Measurement | Dominican | Immigrants from Africa |
| Minimum | 0.84% | 0.17% |
| Maximum | 8.5% | 4.2% |
| Range | 7.6% | 4.0% |
| Mean | 3.0% | 2.1% |
| Median | 2.6% | 2.1% |
| Interquartile 25% (IQ1) | 2.3% | 1.8% |
| Interquartile 75% (IQ3) | 3.6% | 2.3% |
| Interquartile Range (IQR) | 1.3% | 0.50% |
| Standard Deviation (Sample) | 1.3% | 0.70% |
| Standard Deviation (Population) | 1.3% | 0.70% |
Similar Demographics by Vision Disability
Demographics Similar to Dominicans by Vision Disability
In terms of vision disability, the demographic groups most similar to Dominicans are Blackfeet (2.6%, a difference of 0.040%), Immigrants from Yemen (2.6%, a difference of 0.37%), Arapaho (2.6%, a difference of 0.65%), Immigrants from Dominican Republic (2.6%, a difference of 0.67%), and Iroquois (2.6%, a difference of 0.70%).
| Demographics | Rating | Rank | Vision Disability |
| Aleuts | 0.0 /100 | #304 | Tragic 2.6% |
| Hispanics or Latinos | 0.0 /100 | #305 | Tragic 2.6% |
| Iroquois | 0.0 /100 | #306 | Tragic 2.6% |
| Immigrants | Dominican Republic | 0.0 /100 | #307 | Tragic 2.6% |
| Arapaho | 0.0 /100 | #308 | Tragic 2.6% |
| Immigrants | Yemen | 0.0 /100 | #309 | Tragic 2.6% |
| Blackfeet | 0.0 /100 | #310 | Tragic 2.6% |
| Dominicans | 0.0 /100 | #311 | Tragic 2.6% |
| Americans | 0.0 /100 | #312 | Tragic 2.6% |
| Potawatomi | 0.0 /100 | #313 | Tragic 2.6% |
| Inupiat | 0.0 /100 | #314 | Tragic 2.7% |
| Osage | 0.0 /100 | #315 | Tragic 2.7% |
| Shoshone | 0.0 /100 | #316 | Tragic 2.7% |
| Yup'ik | 0.0 /100 | #317 | Tragic 2.7% |
| Alaska Natives | 0.0 /100 | #318 | Tragic 2.7% |
Demographics Similar to Immigrants from Africa by Vision Disability
In terms of vision disability, the demographic groups most similar to Immigrants from Africa are Immigrants from England (2.1%, a difference of 0.010%), Brazilian (2.1%, a difference of 0.030%), Immigrants from Iraq (2.1%, a difference of 0.15%), Immigrants from Bangladesh (2.1%, a difference of 0.20%), and Icelander (2.1%, a difference of 0.24%).
| Demographics | Rating | Rank | Vision Disability |
| Austrians | 69.0 /100 | #160 | Good 2.1% |
| Iraqis | 67.7 /100 | #161 | Good 2.1% |
| Hungarians | 67.4 /100 | #162 | Good 2.1% |
| Icelanders | 66.1 /100 | #163 | Good 2.1% |
| Immigrants | Bangladesh | 65.5 /100 | #164 | Good 2.1% |
| Immigrants | Iraq | 64.8 /100 | #165 | Good 2.1% |
| Immigrants | England | 62.8 /100 | #166 | Good 2.1% |
| Immigrants | Africa | 62.6 /100 | #167 | Good 2.1% |
| Brazilians | 62.2 /100 | #168 | Good 2.1% |
| South American Indians | 57.4 /100 | #169 | Average 2.2% |
| Swiss | 55.7 /100 | #170 | Average 2.2% |
| Lebanese | 54.3 /100 | #171 | Average 2.2% |
| Northern Europeans | 50.1 /100 | #172 | Average 2.2% |
| Scandinavians | 50.0 /100 | #173 | Average 2.2% |
| Immigrants | Canada | 50.0 /100 | #174 | Average 2.2% |