Czechoslovakian vs Immigrants from Moldova 7th Grade
COMPARE
Czechoslovakian
Immigrants from Moldova
7th Grade
7th Grade Comparison
Czechoslovakians
Immigrants from Moldova
97.1%
7TH GRADE
99.9/ 100
METRIC RATING
45th/ 347
METRIC RANK
96.5%
7TH GRADE
95.7/ 100
METRIC RATING
117th/ 347
METRIC RANK
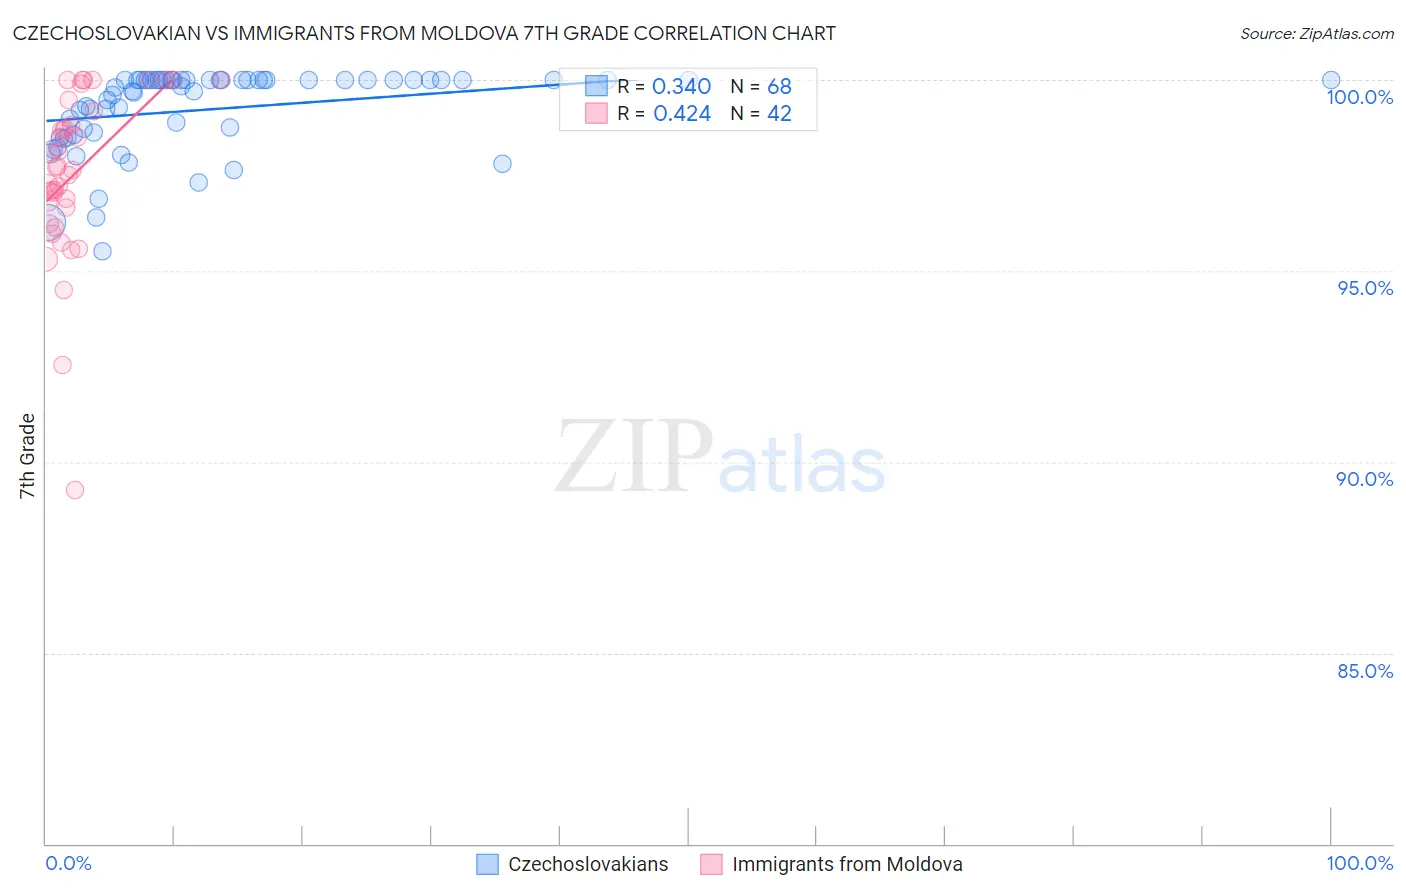
Czechoslovakian vs Immigrants from Moldova 7th Grade Correlation Chart
The statistical analysis conducted on geographies consisting of 368,666,801 people shows a mild positive correlation between the proportion of Czechoslovakians and percentage of population with at least 7th grade education in the United States with a correlation coefficient (R) of 0.340 and weighted average of 97.1%. Similarly, the statistical analysis conducted on geographies consisting of 124,396,843 people shows a moderate positive correlation between the proportion of Immigrants from Moldova and percentage of population with at least 7th grade education in the United States with a correlation coefficient (R) of 0.424 and weighted average of 96.5%, a difference of 0.62%.
7th Grade Correlation Summary
| Measurement | Czechoslovakian | Immigrants from Moldova |
| Minimum | 95.5% | 89.3% |
| Maximum | 100.0% | 100.0% |
| Range | 4.5% | 10.7% |
| Mean | 99.2% | 97.6% |
| Median | 99.9% | 97.7% |
| Interquartile 25% (IQ1) | 98.6% | 96.7% |
| Interquartile 75% (IQ3) | 100.0% | 99.2% |
| Interquartile Range (IQR) | 1.4% | 2.5% |
| Standard Deviation (Sample) | 1.1% | 2.2% |
| Standard Deviation (Population) | 1.1% | 2.2% |
Similar Demographics by 7th Grade
Demographics Similar to Czechoslovakians by 7th Grade
In terms of 7th grade, the demographic groups most similar to Czechoslovakians are Aleut (97.1%, a difference of 0.0%), Maltese (97.1%, a difference of 0.010%), Northern European (97.1%, a difference of 0.010%), Bulgarian (97.1%, a difference of 0.030%), and Celtic (97.1%, a difference of 0.030%).
| Demographics | Rating | Rank | 7th Grade |
| Belgians | 100.0 /100 | #38 | Exceptional 97.2% |
| Latvians | 100.0 /100 | #39 | Exceptional 97.2% |
| Luxembourgers | 100.0 /100 | #40 | Exceptional 97.2% |
| Eastern Europeans | 100.0 /100 | #41 | Exceptional 97.2% |
| Chinese | 99.9 /100 | #42 | Exceptional 97.1% |
| Maltese | 99.9 /100 | #43 | Exceptional 97.1% |
| Northern Europeans | 99.9 /100 | #44 | Exceptional 97.1% |
| Czechoslovakians | 99.9 /100 | #45 | Exceptional 97.1% |
| Aleuts | 99.9 /100 | #46 | Exceptional 97.1% |
| Bulgarians | 99.9 /100 | #47 | Exceptional 97.1% |
| Celtics | 99.9 /100 | #48 | Exceptional 97.1% |
| Slavs | 99.9 /100 | #49 | Exceptional 97.1% |
| Immigrants | Scotland | 99.9 /100 | #50 | Exceptional 97.1% |
| Estonians | 99.9 /100 | #51 | Exceptional 97.0% |
| Greeks | 99.9 /100 | #52 | Exceptional 97.0% |
Demographics Similar to Immigrants from Moldova by 7th Grade
In terms of 7th grade, the demographic groups most similar to Immigrants from Moldova are Immigrants from Japan (96.5%, a difference of 0.010%), Immigrants from Norway (96.5%, a difference of 0.020%), Immigrants from Croatia (96.5%, a difference of 0.020%), Cheyenne (96.5%, a difference of 0.030%), and Immigrants from Europe (96.5%, a difference of 0.030%).
| Demographics | Rating | Rank | 7th Grade |
| Okinawans | 97.4 /100 | #110 | Exceptional 96.6% |
| Immigrants | Latvia | 97.4 /100 | #111 | Exceptional 96.6% |
| Immigrants | Nonimmigrants | 97.0 /100 | #112 | Exceptional 96.5% |
| Pueblo | 96.8 /100 | #113 | Exceptional 96.5% |
| Immigrants | Zimbabwe | 96.6 /100 | #114 | Exceptional 96.5% |
| Choctaw | 96.6 /100 | #115 | Exceptional 96.5% |
| Syrians | 96.6 /100 | #116 | Exceptional 96.5% |
| Immigrants | Moldova | 95.7 /100 | #117 | Exceptional 96.5% |
| Immigrants | Japan | 95.5 /100 | #118 | Exceptional 96.5% |
| Immigrants | Norway | 95.2 /100 | #119 | Exceptional 96.5% |
| Immigrants | Croatia | 95.0 /100 | #120 | Exceptional 96.5% |
| Cheyenne | 94.9 /100 | #121 | Exceptional 96.5% |
| Immigrants | Europe | 94.8 /100 | #122 | Exceptional 96.5% |
| Immigrants | France | 94.7 /100 | #123 | Exceptional 96.5% |
| Immigrants | Switzerland | 94.5 /100 | #124 | Exceptional 96.5% |