Immigrants from Pakistan vs Immigrants from Colombia Disability Age Over 75
COMPARE
Immigrants from Pakistan
Immigrants from Colombia
Disability Age Over 75
Disability Age Over 75 Comparison
Immigrants from Pakistan
Immigrants from Colombia
46.5%
DISABILITY AGE OVER 75
96.1/ 100
METRIC RATING
112th/ 347
METRIC RANK
46.7%
DISABILITY AGE OVER 75
92.6/ 100
METRIC RATING
123rd/ 347
METRIC RANK
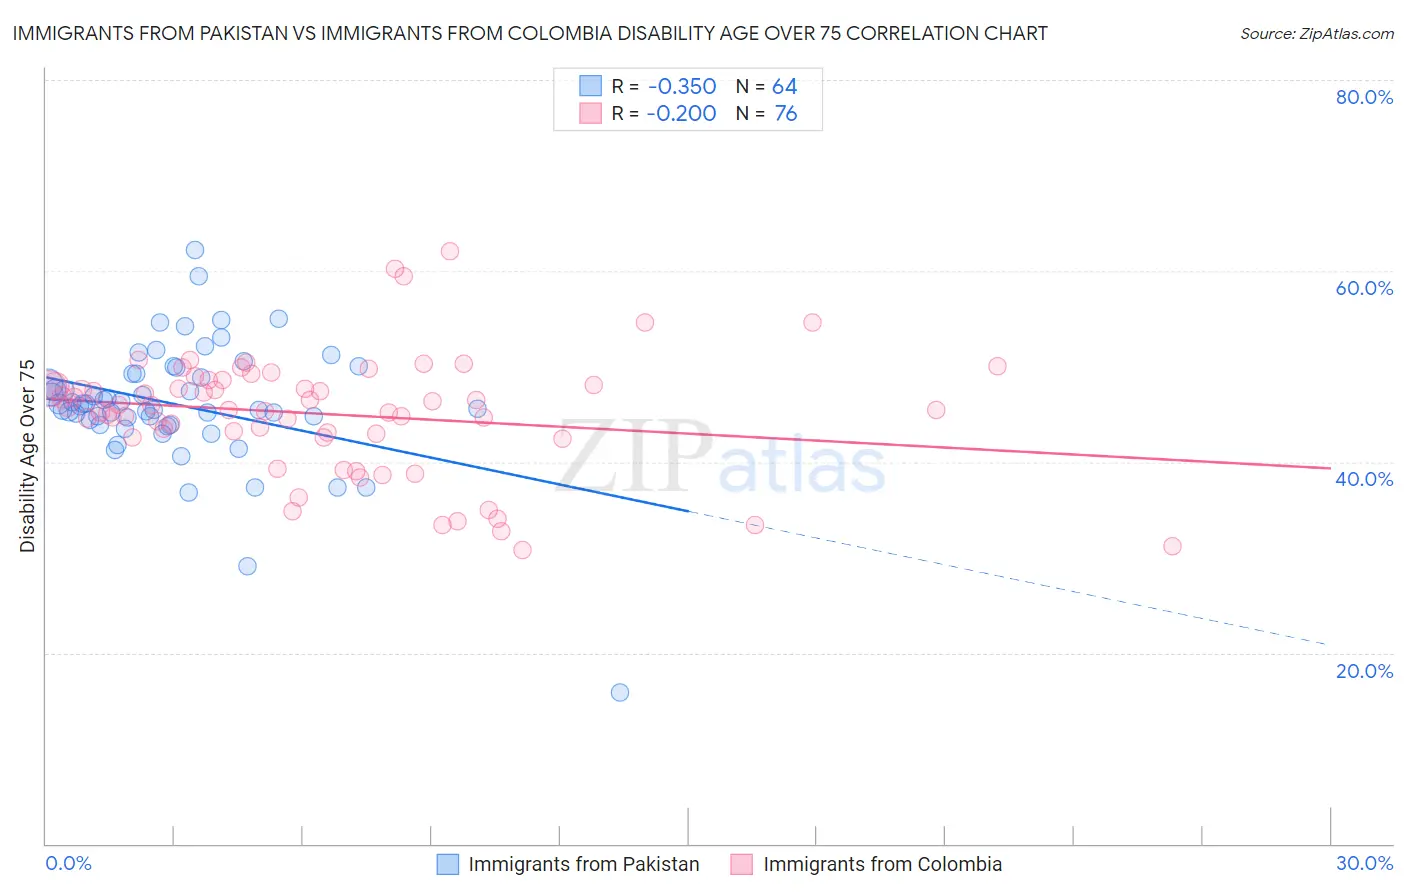
Immigrants from Pakistan vs Immigrants from Colombia Disability Age Over 75 Correlation Chart
The statistical analysis conducted on geographies consisting of 283,596,360 people shows a mild negative correlation between the proportion of Immigrants from Pakistan and percentage of population with a disability over the age of 75 in the United States with a correlation coefficient (R) of -0.350 and weighted average of 46.5%. Similarly, the statistical analysis conducted on geographies consisting of 378,064,071 people shows a poor negative correlation between the proportion of Immigrants from Colombia and percentage of population with a disability over the age of 75 in the United States with a correlation coefficient (R) of -0.200 and weighted average of 46.7%, a difference of 0.39%.
Disability Age Over 75 Correlation Summary
| Measurement | Immigrants from Pakistan | Immigrants from Colombia |
| Minimum | 15.8% | 30.8% |
| Maximum | 62.2% | 62.0% |
| Range | 46.5% | 31.2% |
| Mean | 46.0% | 45.0% |
| Median | 46.0% | 45.6% |
| Interquartile 25% (IQ1) | 44.2% | 42.8% |
| Interquartile 75% (IQ3) | 49.2% | 48.3% |
| Interquartile Range (IQR) | 5.0% | 5.5% |
| Standard Deviation (Sample) | 6.5% | 6.2% |
| Standard Deviation (Population) | 6.5% | 6.2% |
Demographics Similar to Immigrants from Pakistan and Immigrants from Colombia by Disability Age Over 75
In terms of disability age over 75, the demographic groups most similar to Immigrants from Pakistan are Irish (46.5%, a difference of 0.020%), Dutch (46.5%, a difference of 0.030%), Immigrants from Hong Kong (46.5%, a difference of 0.040%), Immigrants from Chile (46.5%, a difference of 0.040%), and Chilean (46.5%, a difference of 0.050%). Similarly, the demographic groups most similar to Immigrants from Colombia are Immigrants from Albania (46.6%, a difference of 0.050%), Immigrants from South America (46.7%, a difference of 0.060%), Colombian (46.7%, a difference of 0.090%), Scandinavian (46.6%, a difference of 0.10%), and European (46.7%, a difference of 0.10%).
| Demographics | Rating | Rank | Disability Age Over 75 |
| Immigrants | Uruguay | 96.7 /100 | #107 | Exceptional 46.4% |
| Brazilians | 96.6 /100 | #108 | Exceptional 46.5% |
| Chileans | 96.4 /100 | #109 | Exceptional 46.5% |
| Immigrants | Hong Kong | 96.4 /100 | #110 | Exceptional 46.5% |
| Immigrants | Chile | 96.4 /100 | #111 | Exceptional 46.5% |
| Immigrants | Pakistan | 96.1 /100 | #112 | Exceptional 46.5% |
| Irish | 96.0 /100 | #113 | Exceptional 46.5% |
| Dutch | 95.9 /100 | #114 | Exceptional 46.5% |
| British | 95.7 /100 | #115 | Exceptional 46.5% |
| Indians (Asian) | 95.7 /100 | #116 | Exceptional 46.5% |
| Hungarians | 95.3 /100 | #117 | Exceptional 46.5% |
| Czechoslovakians | 94.7 /100 | #118 | Exceptional 46.6% |
| Canadians | 94.4 /100 | #119 | Exceptional 46.6% |
| Immigrants | Nepal | 94.1 /100 | #120 | Exceptional 46.6% |
| Scandinavians | 93.6 /100 | #121 | Exceptional 46.6% |
| Immigrants | Albania | 93.2 /100 | #122 | Exceptional 46.6% |
| Immigrants | Colombia | 92.6 /100 | #123 | Exceptional 46.7% |
| Immigrants | South America | 91.8 /100 | #124 | Exceptional 46.7% |
| Colombians | 91.3 /100 | #125 | Exceptional 46.7% |
| Europeans | 91.2 /100 | #126 | Exceptional 46.7% |
| Syrians | 91.1 /100 | #127 | Exceptional 46.7% |