Immigrants from Northern Europe vs Immigrants from South America Disability Age 65 to 74
COMPARE
Immigrants from Northern Europe
Immigrants from South America
Disability Age 65 to 74
Disability Age 65 to 74 Comparison
Immigrants from Northern Europe
Immigrants from South America
21.0%
DISABILITY AGE 65 TO 74
99.9/ 100
METRIC RATING
31st/ 347
METRIC RANK
22.3%
DISABILITY AGE 65 TO 74
95.5/ 100
METRIC RATING
112th/ 347
METRIC RANK
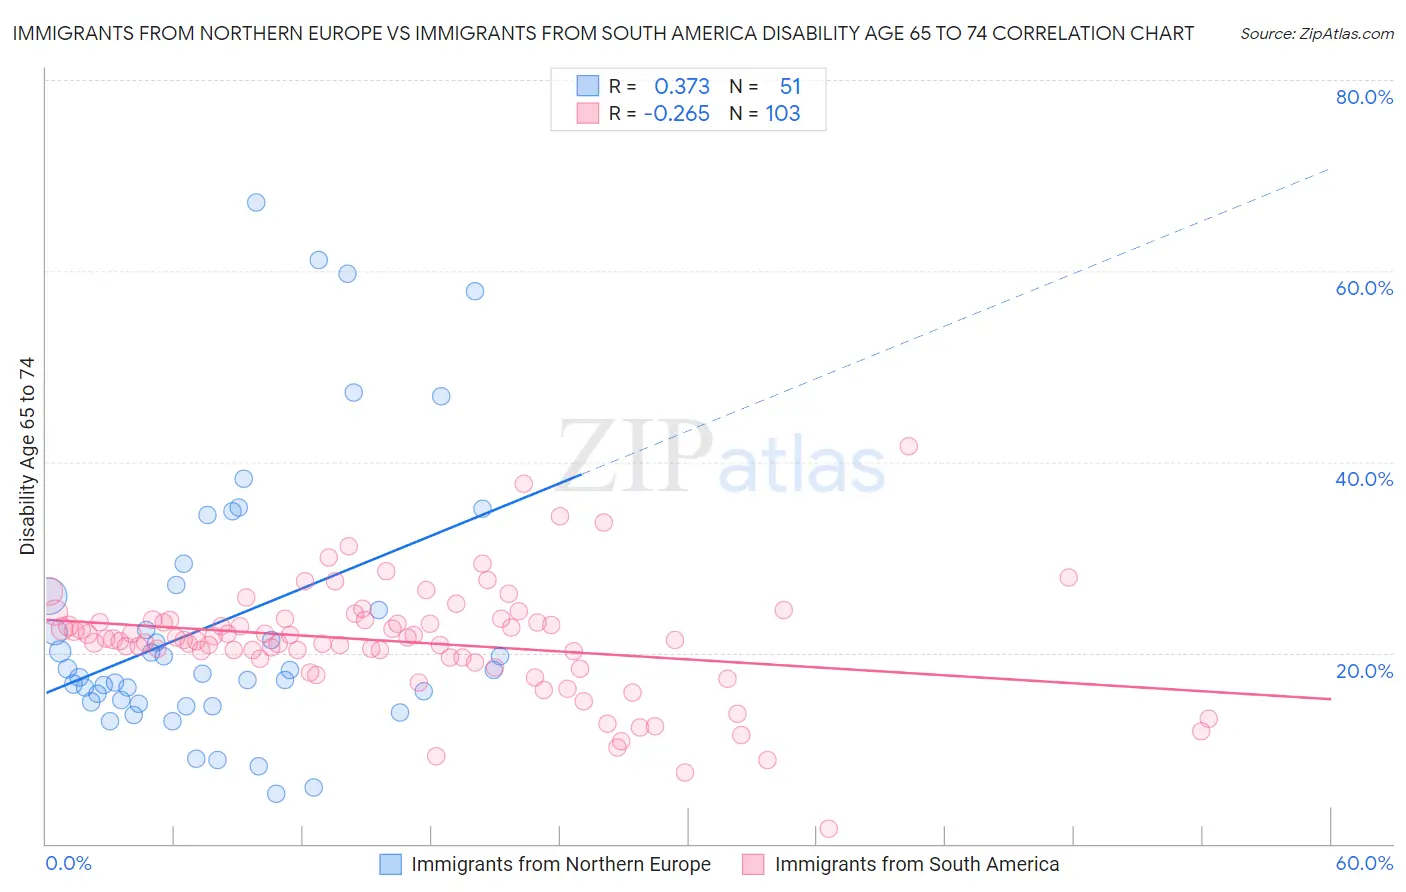
Immigrants from Northern Europe vs Immigrants from South America Disability Age 65 to 74 Correlation Chart
The statistical analysis conducted on geographies consisting of 476,301,514 people shows a mild positive correlation between the proportion of Immigrants from Northern Europe and percentage of population with a disability between the ages 65 and 75 in the United States with a correlation coefficient (R) of 0.373 and weighted average of 21.0%. Similarly, the statistical analysis conducted on geographies consisting of 485,069,818 people shows a weak negative correlation between the proportion of Immigrants from South America and percentage of population with a disability between the ages 65 and 75 in the United States with a correlation coefficient (R) of -0.265 and weighted average of 22.3%, a difference of 6.1%.
Disability Age 65 to 74 Correlation Summary
| Measurement | Immigrants from Northern Europe | Immigrants from South America |
| Minimum | 5.2% | 1.6% |
| Maximum | 67.1% | 41.7% |
| Range | 61.9% | 40.1% |
| Mean | 23.4% | 21.2% |
| Median | 18.2% | 21.4% |
| Interquartile 25% (IQ1) | 14.9% | 19.3% |
| Interquartile 75% (IQ3) | 27.1% | 23.4% |
| Interquartile Range (IQR) | 12.2% | 4.1% |
| Standard Deviation (Sample) | 14.5% | 5.9% |
| Standard Deviation (Population) | 14.3% | 5.9% |
Similar Demographics by Disability Age 65 to 74
Demographics Similar to Immigrants from Northern Europe by Disability Age 65 to 74
In terms of disability age 65 to 74, the demographic groups most similar to Immigrants from Northern Europe are Turkish (21.0%, a difference of 0.030%), Immigrants from Greece (21.0%, a difference of 0.040%), Immigrants from Japan (21.0%, a difference of 0.080%), Immigrants from Czechoslovakia (21.0%, a difference of 0.12%), and Immigrants from Sweden (21.0%, a difference of 0.22%).
| Demographics | Rating | Rank | Disability Age 65 to 74 |
| Soviet Union | 99.9 /100 | #24 | Exceptional 21.0% |
| Bolivians | 99.9 /100 | #25 | Exceptional 21.0% |
| Immigrants | Australia | 99.9 /100 | #26 | Exceptional 21.0% |
| Immigrants | Sweden | 99.9 /100 | #27 | Exceptional 21.0% |
| Immigrants | Czechoslovakia | 99.9 /100 | #28 | Exceptional 21.0% |
| Immigrants | Japan | 99.9 /100 | #29 | Exceptional 21.0% |
| Immigrants | Greece | 99.9 /100 | #30 | Exceptional 21.0% |
| Immigrants | Northern Europe | 99.9 /100 | #31 | Exceptional 21.0% |
| Turks | 99.9 /100 | #32 | Exceptional 21.0% |
| Immigrants | Argentina | 99.9 /100 | #33 | Exceptional 21.1% |
| Immigrants | Sri Lanka | 99.9 /100 | #34 | Exceptional 21.1% |
| Bulgarians | 99.9 /100 | #35 | Exceptional 21.1% |
| Immigrants | Switzerland | 99.8 /100 | #36 | Exceptional 21.1% |
| Israelis | 99.8 /100 | #37 | Exceptional 21.2% |
| Russians | 99.8 /100 | #38 | Exceptional 21.2% |
Demographics Similar to Immigrants from South America by Disability Age 65 to 74
In terms of disability age 65 to 74, the demographic groups most similar to Immigrants from South America are Syrian (22.3%, a difference of 0.050%), Serbian (22.3%, a difference of 0.060%), Immigrants from Peru (22.3%, a difference of 0.080%), Albanian (22.3%, a difference of 0.13%), and Ukrainian (22.3%, a difference of 0.14%).
| Demographics | Rating | Rank | Disability Age 65 to 74 |
| Palestinians | 96.3 /100 | #105 | Exceptional 22.2% |
| Peruvians | 96.1 /100 | #106 | Exceptional 22.2% |
| Slovenes | 96.1 /100 | #107 | Exceptional 22.2% |
| Immigrants | Zimbabwe | 96.1 /100 | #108 | Exceptional 22.3% |
| Albanians | 95.8 /100 | #109 | Exceptional 22.3% |
| Immigrants | Peru | 95.7 /100 | #110 | Exceptional 22.3% |
| Serbians | 95.7 /100 | #111 | Exceptional 22.3% |
| Immigrants | South America | 95.5 /100 | #112 | Exceptional 22.3% |
| Syrians | 95.3 /100 | #113 | Exceptional 22.3% |
| Ukrainians | 95.1 /100 | #114 | Exceptional 22.3% |
| Laotians | 94.9 /100 | #115 | Exceptional 22.3% |
| Brazilians | 94.8 /100 | #116 | Exceptional 22.4% |
| Swedes | 94.7 /100 | #117 | Exceptional 22.4% |
| Austrians | 94.7 /100 | #118 | Exceptional 22.4% |
| Immigrants | Northern Africa | 94.7 /100 | #119 | Exceptional 22.4% |