Cree vs Immigrants from Thailand Disability Age Over 75
COMPARE
Cree
Immigrants from Thailand
Disability Age Over 75
Disability Age Over 75 Comparison
Cree
Immigrants from Thailand
48.2%
DISABILITY AGE OVER 75
4.2/ 100
METRIC RATING
233rd/ 347
METRIC RANK
48.3%
DISABILITY AGE OVER 75
2.8/ 100
METRIC RATING
239th/ 347
METRIC RANK
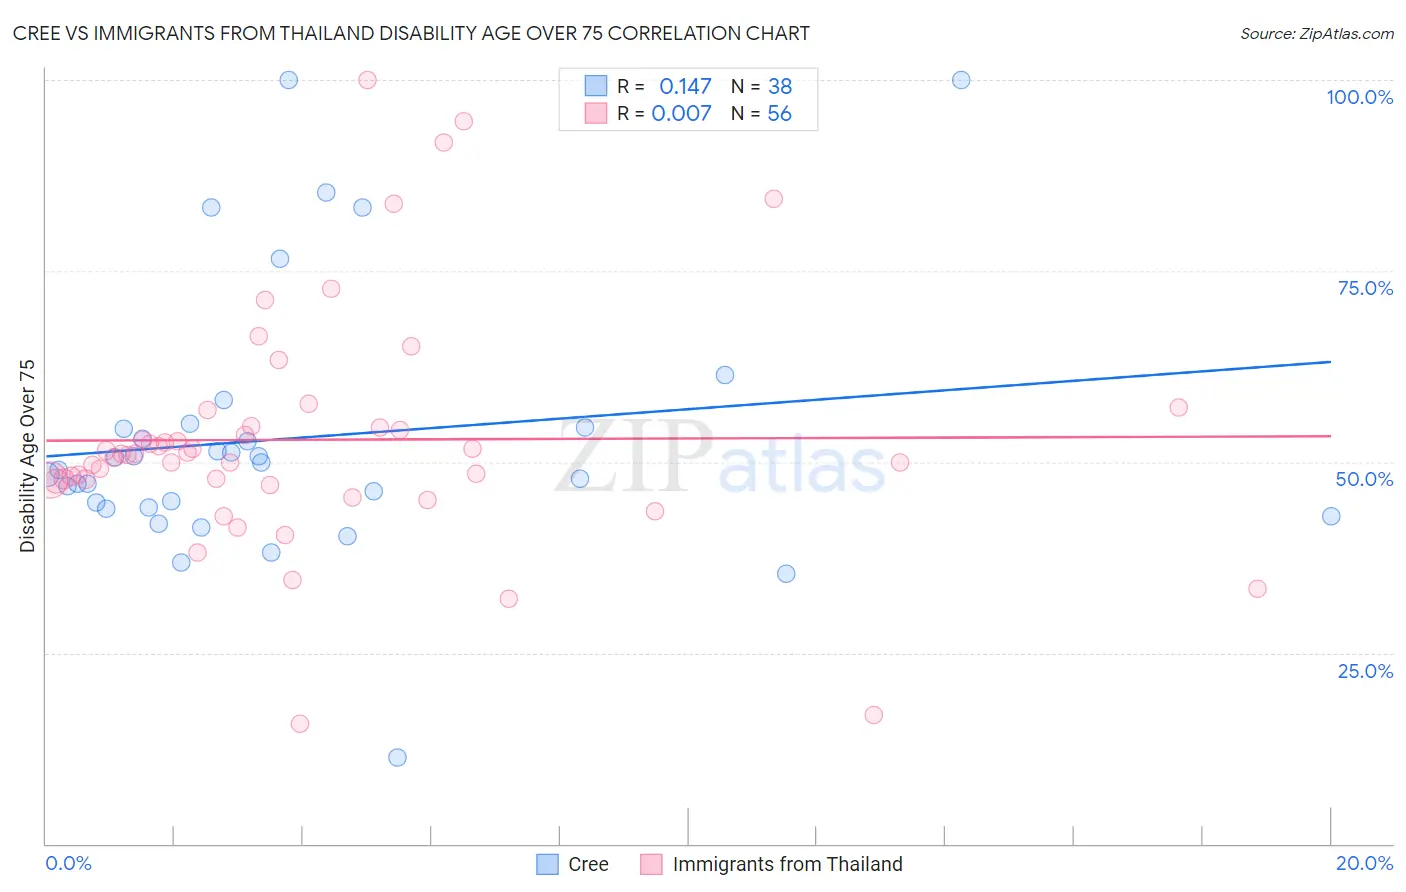
Cree vs Immigrants from Thailand Disability Age Over 75 Correlation Chart
The statistical analysis conducted on geographies consisting of 76,193,108 people shows a poor positive correlation between the proportion of Cree and percentage of population with a disability over the age of 75 in the United States with a correlation coefficient (R) of 0.147 and weighted average of 48.2%. Similarly, the statistical analysis conducted on geographies consisting of 316,651,831 people shows no correlation between the proportion of Immigrants from Thailand and percentage of population with a disability over the age of 75 in the United States with a correlation coefficient (R) of 0.007 and weighted average of 48.3%, a difference of 0.24%.
Disability Age Over 75 Correlation Summary
| Measurement | Cree | Immigrants from Thailand |
| Minimum | 11.2% | 15.8% |
| Maximum | 100.0% | 100.0% |
| Range | 88.8% | 84.2% |
| Mean | 53.2% | 52.9% |
| Median | 49.4% | 51.0% |
| Interquartile 25% (IQ1) | 44.0% | 47.5% |
| Interquartile 75% (IQ3) | 54.4% | 54.6% |
| Interquartile Range (IQR) | 10.4% | 7.1% |
| Standard Deviation (Sample) | 17.7% | 15.7% |
| Standard Deviation (Population) | 17.5% | 15.6% |
Demographics Similar to Cree and Immigrants from Thailand by Disability Age Over 75
In terms of disability age over 75, the demographic groups most similar to Cree are Indonesian (48.2%, a difference of 0.0%), Immigrants (48.2%, a difference of 0.020%), Taiwanese (48.2%, a difference of 0.030%), Subsaharan African (48.2%, a difference of 0.060%), and Hmong (48.2%, a difference of 0.070%). Similarly, the demographic groups most similar to Immigrants from Thailand are Nicaraguan (48.3%, a difference of 0.040%), Immigrants from Nicaragua (48.2%, a difference of 0.080%), Immigrants from St. Vincent and the Grenadines (48.2%, a difference of 0.080%), Tongan (48.3%, a difference of 0.11%), and Native Hawaiian (48.3%, a difference of 0.12%).
| Demographics | Rating | Rank | Disability Age Over 75 |
| Immigrants | Nonimmigrants | 6.5 /100 | #226 | Tragic 48.0% |
| Zimbabweans | 6.4 /100 | #227 | Tragic 48.1% |
| Immigrants | Liberia | 5.9 /100 | #228 | Tragic 48.1% |
| Spaniards | 5.7 /100 | #229 | Tragic 48.1% |
| Taiwanese | 4.4 /100 | #230 | Tragic 48.2% |
| Immigrants | Immigrants | 4.3 /100 | #231 | Tragic 48.2% |
| Indonesians | 4.2 /100 | #232 | Tragic 48.2% |
| Cree | 4.2 /100 | #233 | Tragic 48.2% |
| Sub-Saharan Africans | 3.8 /100 | #234 | Tragic 48.2% |
| Hmong | 3.8 /100 | #235 | Tragic 48.2% |
| Immigrants | Nicaragua | 3.2 /100 | #236 | Tragic 48.2% |
| Immigrants | St. Vincent and the Grenadines | 3.2 /100 | #237 | Tragic 48.2% |
| Nicaraguans | 3.0 /100 | #238 | Tragic 48.3% |
| Immigrants | Thailand | 2.8 /100 | #239 | Tragic 48.3% |
| Tongans | 2.3 /100 | #240 | Tragic 48.3% |
| Native Hawaiians | 2.2 /100 | #241 | Tragic 48.3% |
| French American Indians | 2.2 /100 | #242 | Tragic 48.3% |
| Immigrants | Caribbean | 2.1 /100 | #243 | Tragic 48.4% |
| Afghans | 1.8 /100 | #244 | Tragic 48.4% |
| Americans | 1.7 /100 | #245 | Tragic 48.4% |
| Chippewa | 1.6 /100 | #246 | Tragic 48.4% |