Immigrants from Mexico vs Ottawa Disability Age 18 to 34
COMPARE
Immigrants from Mexico
Ottawa
Disability Age 18 to 34
Disability Age 18 to 34 Comparison
Immigrants from Mexico
Ottawa
6.6%
DISABILITY AGE 18 TO 34
54.1/ 100
METRIC RATING
173rd/ 347
METRIC RANK
8.6%
DISABILITY AGE 18 TO 34
0.0/ 100
METRIC RATING
337th/ 347
METRIC RANK
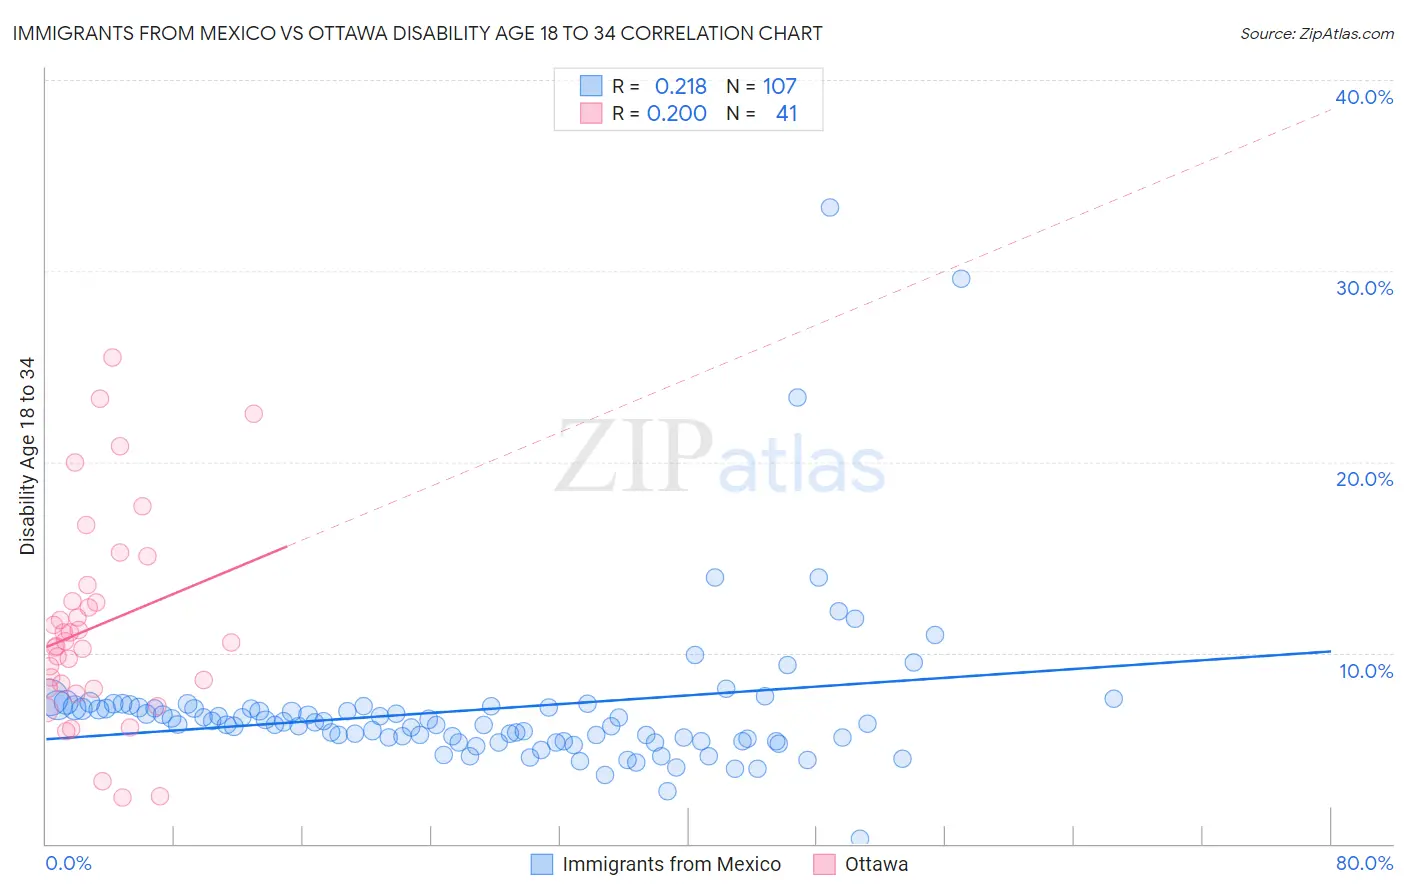
Immigrants from Mexico vs Ottawa Disability Age 18 to 34 Correlation Chart
The statistical analysis conducted on geographies consisting of 510,880,609 people shows a weak positive correlation between the proportion of Immigrants from Mexico and percentage of population with a disability between the ages 18 and 35 in the United States with a correlation coefficient (R) of 0.218 and weighted average of 6.6%. Similarly, the statistical analysis conducted on geographies consisting of 49,926,401 people shows a poor positive correlation between the proportion of Ottawa and percentage of population with a disability between the ages 18 and 35 in the United States with a correlation coefficient (R) of 0.200 and weighted average of 8.6%, a difference of 30.4%.
Disability Age 18 to 34 Correlation Summary
| Measurement | Immigrants from Mexico | Ottawa |
| Minimum | 0.28% | 2.4% |
| Maximum | 33.3% | 25.5% |
| Range | 33.1% | 23.0% |
| Mean | 7.0% | 11.4% |
| Median | 6.3% | 10.5% |
| Interquartile 25% (IQ1) | 5.4% | 8.1% |
| Interquartile 75% (IQ3) | 7.1% | 13.1% |
| Interquartile Range (IQR) | 1.8% | 5.0% |
| Standard Deviation (Sample) | 4.2% | 5.4% |
| Standard Deviation (Population) | 4.2% | 5.3% |
Similar Demographics by Disability Age 18 to 34
Demographics Similar to Immigrants from Mexico by Disability Age 18 to 34
In terms of disability age 18 to 34, the demographic groups most similar to Immigrants from Mexico are Ghanaian (6.6%, a difference of 0.040%), Bahamian (6.6%, a difference of 0.10%), Immigrants from Bahamas (6.6%, a difference of 0.27%), Native Hawaiian (6.6%, a difference of 0.29%), and Russian (6.5%, a difference of 0.44%).
| Demographics | Rating | Rank | Disability Age 18 to 34 |
| Eastern Europeans | 65.1 /100 | #166 | Good 6.5% |
| Immigrants | Northern Europe | 64.1 /100 | #167 | Good 6.5% |
| Immigrants | Moldova | 63.1 /100 | #168 | Good 6.5% |
| Russians | 60.2 /100 | #169 | Good 6.5% |
| Immigrants | Bahamas | 57.9 /100 | #170 | Average 6.6% |
| Bahamians | 55.5 /100 | #171 | Average 6.6% |
| Ghanaians | 54.7 /100 | #172 | Average 6.6% |
| Immigrants | Mexico | 54.1 /100 | #173 | Average 6.6% |
| Native Hawaiians | 50.0 /100 | #174 | Average 6.6% |
| Immigrants | Cambodia | 46.5 /100 | #175 | Average 6.6% |
| Immigrants | Africa | 45.9 /100 | #176 | Average 6.6% |
| Syrians | 44.3 /100 | #177 | Average 6.6% |
| Nigerians | 43.7 /100 | #178 | Average 6.6% |
| Immigrants | Ghana | 42.1 /100 | #179 | Average 6.6% |
| Immigrants | Austria | 39.6 /100 | #180 | Fair 6.6% |
Demographics Similar to Ottawa by Disability Age 18 to 34
In terms of disability age 18 to 34, the demographic groups most similar to Ottawa are Immigrants from the Azores (8.5%, a difference of 0.47%), Cherokee (8.7%, a difference of 1.5%), Seminole (8.4%, a difference of 1.7%), Dutch West Indian (8.4%, a difference of 1.8%), and Apache (8.4%, a difference of 2.0%).
| Demographics | Rating | Rank | Disability Age 18 to 34 |
| Osage | 0.0 /100 | #330 | Tragic 8.3% |
| Comanche | 0.0 /100 | #331 | Tragic 8.3% |
| Puget Sound Salish | 0.0 /100 | #332 | Tragic 8.3% |
| Apache | 0.0 /100 | #333 | Tragic 8.4% |
| Dutch West Indians | 0.0 /100 | #334 | Tragic 8.4% |
| Seminole | 0.0 /100 | #335 | Tragic 8.4% |
| Immigrants | Azores | 0.0 /100 | #336 | Tragic 8.5% |
| Ottawa | 0.0 /100 | #337 | Tragic 8.6% |
| Cherokee | 0.0 /100 | #338 | Tragic 8.7% |
| Kiowa | 0.0 /100 | #339 | Tragic 8.8% |
| Choctaw | 0.0 /100 | #340 | Tragic 9.0% |
| Chickasaw | 0.0 /100 | #341 | Tragic 9.0% |
| Yakama | 0.0 /100 | #342 | Tragic 9.0% |
| Chippewa | 0.0 /100 | #343 | Tragic 9.0% |
| Creek | 0.0 /100 | #344 | Tragic 9.0% |