Cambodian vs Immigrants from Poland Disability Age 18 to 34
COMPARE
Cambodian
Immigrants from Poland
Disability Age 18 to 34
Disability Age 18 to 34 Comparison
Cambodians
Immigrants from Poland
6.2%
DISABILITY AGE 18 TO 34
97.8/ 100
METRIC RATING
88th/ 347
METRIC RANK
6.0%
DISABILITY AGE 18 TO 34
99.5/ 100
METRIC RATING
68th/ 347
METRIC RANK
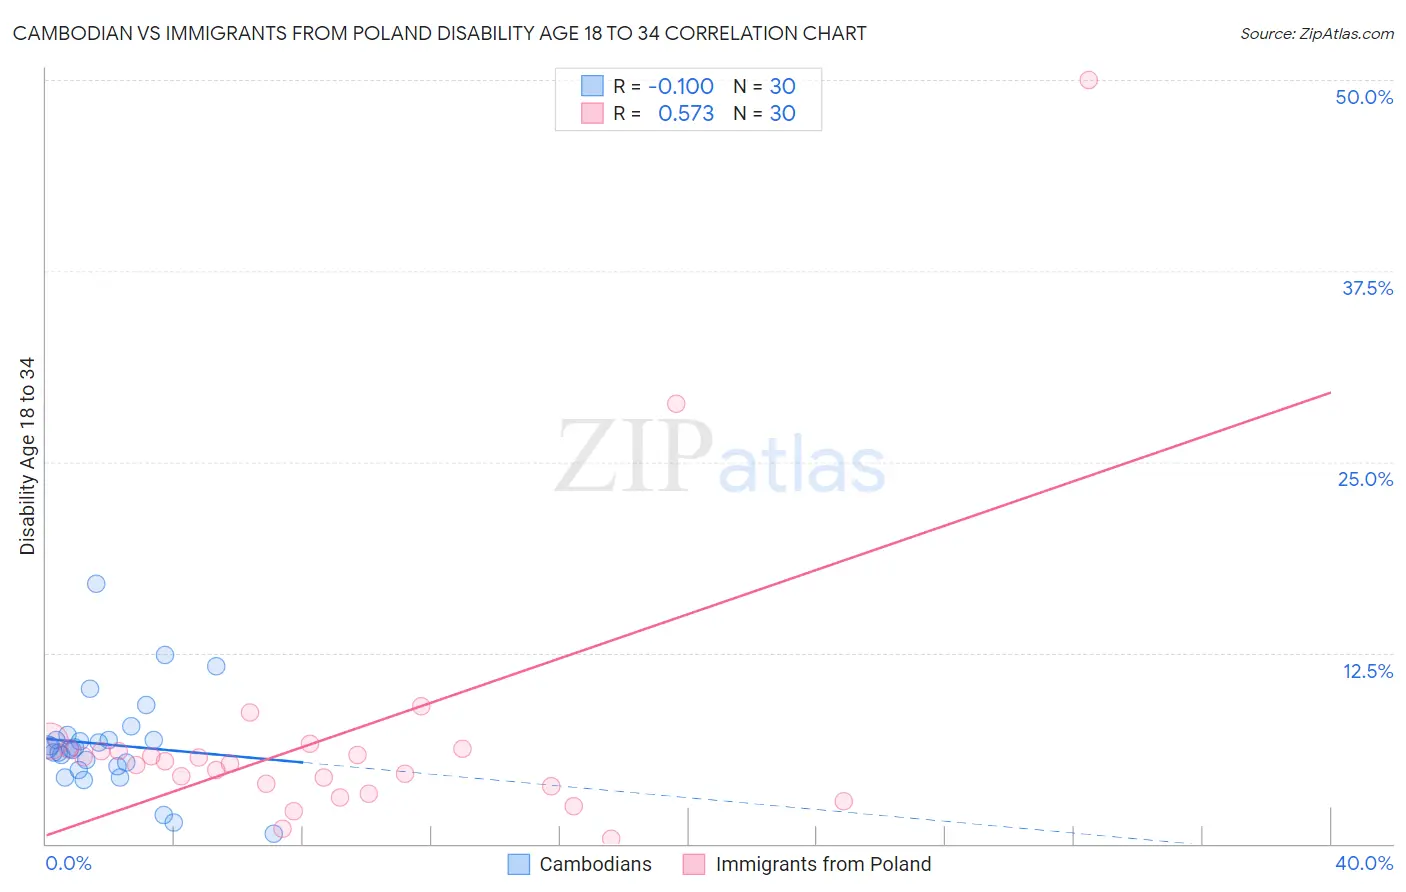
Cambodian vs Immigrants from Poland Disability Age 18 to 34 Correlation Chart
The statistical analysis conducted on geographies consisting of 102,463,205 people shows a slight negative correlation between the proportion of Cambodians and percentage of population with a disability between the ages 18 and 35 in the United States with a correlation coefficient (R) of -0.100 and weighted average of 6.2%. Similarly, the statistical analysis conducted on geographies consisting of 304,148,718 people shows a substantial positive correlation between the proportion of Immigrants from Poland and percentage of population with a disability between the ages 18 and 35 in the United States with a correlation coefficient (R) of 0.573 and weighted average of 6.0%, a difference of 2.7%.
Disability Age 18 to 34 Correlation Summary
| Measurement | Cambodian | Immigrants from Poland |
| Minimum | 0.65% | 0.33% |
| Maximum | 17.1% | 50.0% |
| Range | 16.4% | 49.7% |
| Mean | 6.5% | 7.1% |
| Median | 6.2% | 5.3% |
| Interquartile 25% (IQ1) | 5.1% | 3.8% |
| Interquartile 75% (IQ3) | 6.8% | 6.2% |
| Interquartile Range (IQR) | 1.8% | 2.4% |
| Standard Deviation (Sample) | 3.2% | 9.4% |
| Standard Deviation (Population) | 3.2% | 9.2% |
Demographics Similar to Cambodians and Immigrants from Poland by Disability Age 18 to 34
In terms of disability age 18 to 34, the demographic groups most similar to Cambodians are Immigrants from Eastern Europe (6.2%, a difference of 0.030%), Immigrants from Kuwait (6.2%, a difference of 0.11%), Immigrants from Ireland (6.1%, a difference of 0.34%), Israeli (6.1%, a difference of 0.42%), and Barbadian (6.1%, a difference of 0.45%). Similarly, the demographic groups most similar to Immigrants from Poland are Immigrants from West Indies (6.0%, a difference of 0.25%), Immigrants from Greece (6.0%, a difference of 0.31%), Immigrants from Japan (6.0%, a difference of 0.58%), Immigrants from Lebanon (6.0%, a difference of 0.70%), and Cypriot (6.0%, a difference of 0.70%).
| Demographics | Rating | Rank | Disability Age 18 to 34 |
| Immigrants | Poland | 99.5 /100 | #68 | Exceptional 6.0% |
| Immigrants | West Indies | 99.4 /100 | #69 | Exceptional 6.0% |
| Immigrants | Greece | 99.4 /100 | #70 | Exceptional 6.0% |
| Immigrants | Japan | 99.3 /100 | #71 | Exceptional 6.0% |
| Immigrants | Lebanon | 99.2 /100 | #72 | Exceptional 6.0% |
| Cypriots | 99.2 /100 | #73 | Exceptional 6.0% |
| Haitians | 99.2 /100 | #74 | Exceptional 6.0% |
| Immigrants | Turkey | 99.1 /100 | #75 | Exceptional 6.1% |
| Immigrants | Western Asia | 98.9 /100 | #76 | Exceptional 6.1% |
| Immigrants | Russia | 98.9 /100 | #77 | Exceptional 6.1% |
| Assyrians/Chaldeans/Syriacs | 98.9 /100 | #78 | Exceptional 6.1% |
| Afghans | 98.7 /100 | #79 | Exceptional 6.1% |
| Immigrants | Chile | 98.5 /100 | #80 | Exceptional 6.1% |
| Immigrants | Australia | 98.5 /100 | #81 | Exceptional 6.1% |
| Immigrants | Northern Africa | 98.4 /100 | #82 | Exceptional 6.1% |
| Barbadians | 98.3 /100 | #83 | Exceptional 6.1% |
| Israelis | 98.3 /100 | #84 | Exceptional 6.1% |
| Immigrants | Ireland | 98.2 /100 | #85 | Exceptional 6.1% |
| Immigrants | Kuwait | 98.0 /100 | #86 | Exceptional 6.2% |
| Immigrants | Eastern Europe | 97.9 /100 | #87 | Exceptional 6.2% |
| Cambodians | 97.8 /100 | #88 | Exceptional 6.2% |