Bolivian vs Immigrants from Western Africa Self-Care Disability

COMPARE

Bolivian
Race
Ancestry
AfghanAfricanAlaska NativeAlaskan AthabascanAlbanianAleutAlsatianAmericanApacheArabArapahoArgentineanArmenianAssyrian/Chaldean/SyriacAustralianAustrianBahamianBangladeshiBarbadianBasqueBelgianBelizeanBermudanBhutaneseBlackfeetBolivianBrazilianBritishBritish West IndianBulgarianBurmeseCajunCambodianCanadianCape VerdeanCarpatho RusynCelticCentral AmericanCentral American IndianCherokeeCheyenneChickasawChileanChineseChippewaChoctawColombianColvilleComancheCosta RicanCreeCreekCroatianCrowCubanCypriotCzechCzechoslovakianDanishDelawareDominicanDutchDutch West IndianEastern EuropeanEcuadorianEgyptianEnglishEstonianEthiopianEuropeanFijianFilipinoFinnishFrenchFrench American IndianFrench CanadianGermanGerman RussianGhanaianGreekGuamanian/ChamorroGuatemalanGuyaneseHaitianHmongHonduranHopiHoumaHungarianIcelanderIndian (Asian)IndonesianInupiatIranianIraqiIrishIroquoisIsraeliItalianJamaicanJapaneseJordanianKenyanKiowaKoreanLaotianLatvianLebaneseLiberianLithuanianLumbeeLuxembourgerMacedonianMalaysianMalteseMarshalleseMenomineeMexicanMexican American IndianMongolianMoroccanNative HawaiianNavajoNepaleseNew ZealanderNicaraguanNigerianNorthern EuropeanNorwegianOkinawanOsageOttawaPaiutePakistaniPalestinianPanamanianParaguayanPennsylvania GermanPeruvianPimaPolishPortuguesePotawatomiPuebloPuerto RicanPuget Sound SalishRomanianRussianSalvadoranSamoanScandinavianScotch-IrishScottishSeminoleSenegaleseSerbianShoshoneSierra LeoneanSiouxSlavicSlovakSloveneSomaliSouth AfricanSouth AmericanSouth American IndianSoviet UnionSpaniardSpanishSpanish AmericanSpanish American IndianSri LankanSubsaharan AfricanSudaneseSwedishSwissSyrianTaiwaneseThaiTlingit-HaidaTohono O'OdhamTonganTrinidadian and TobagonianTsimshianTurkishU.S. Virgin IslanderUgandanUkrainianUruguayanUteVenezuelanVietnameseWelshWest IndianYakamaYaquiYugoslavianYumanYup'ikZimbabwean
Immigration
NonimmigrantsImmigrantsAfghanistanAfricaAlbaniaArgentinaArmeniaAsiaAustraliaAustriaBahamasBangladeshBarbadosBelarusBelgiumBelizeBoliviaBosnia and HerzegovinaBrazilBulgariaBurma/MyanmarCabo VerdeCambodiaCameroonCanadaCaribbeanCentral AmericaChileChinaColombiaCongoCosta RicaCroatiaCubaCzechoslovakiaDenmarkDominicaDominican RepublicEastern AfricaEastern AsiaEastern EuropeEcuadorEgyptEl SalvadorEnglandEritreaEthiopiaEuropeFijiFranceGermanyGhanaGreeceGrenadaGuatemalaGuyanaHaitiHondurasHong KongHungaryIndiaIndonesiaIranIraqIrelandIsraelItalyJamaicaJapanJordanKazakhstanKenyaKoreaKuwaitLaosLatin AmericaLatviaLebanonLiberiaLithuaniaMalaysiaMexicoMicronesiaMiddle AfricaMoldovaMoroccoNepalNetherlandsNicaraguaNigeriaNorth AmericaNorth MacedoniaNorthern AfricaNorthern EuropeNorwayOceaniaPakistanPanamaPeruPhilippinesPolandPortugalRomaniaRussiaSaudi ArabiaScotlandSenegalSerbiaSierra LeoneSingaporeSomaliaSouth AfricaSouth AmericaSouth Central AsiaSouth Eastern AsiaSouthern EuropeSpainSri LankaSt. Vincent and the GrenadinesSudanSwedenSwitzerlandSyriaTaiwanThailandTrinidad and TobagoTurkeyUgandaUkraineUruguayUzbekistanVenezuelaVietnamWest IndiesWestern AsiaWestern EuropeYemenZaireZimbabweAzores
Immigrants from Western Africa
Race
Ancestry
AfghanAfricanAlaska NativeAlaskan AthabascanAlbanianAleutAlsatianAmericanApacheArabArapahoArgentineanArmenianAssyrian/Chaldean/SyriacAustralianAustrianBahamianBangladeshiBarbadianBasqueBelgianBelizeanBermudanBhutaneseBlackfeetBrazilianBritishBritish West IndianBulgarianBurmeseCajunCambodianCanadianCape VerdeanCarpatho RusynCelticCentral AmericanCentral American IndianCherokeeCheyenneChickasawChileanChineseChippewaChoctawColombianColvilleComancheCosta RicanCreeCreekCroatianCrowCubanCypriotCzechCzechoslovakianDanishDelawareDominicanDutchDutch West IndianEastern EuropeanEcuadorianEgyptianEnglishEstonianEthiopianEuropeanFijianFilipinoFinnishFrenchFrench American IndianFrench CanadianGermanGerman RussianGhanaianGreekGuamanian/ChamorroGuatemalanGuyaneseHaitianHmongHonduranHopiHoumaHungarianIcelanderIndian (Asian)IndonesianInupiatIranianIraqiIrishIroquoisIsraeliItalianJamaicanJapaneseJordanianKenyanKiowaKoreanLaotianLatvianLebaneseLiberianLithuanianLumbeeLuxembourgerMacedonianMalaysianMalteseMarshalleseMenomineeMexicanMexican American IndianMongolianMoroccanNative HawaiianNavajoNepaleseNew ZealanderNicaraguanNigerianNorthern EuropeanNorwegianOkinawanOsageOttawaPaiutePakistaniPalestinianPanamanianParaguayanPennsylvania GermanPeruvianPimaPolishPortuguesePotawatomiPuebloPuerto RicanPuget Sound SalishRomanianRussianSalvadoranSamoanScandinavianScotch-IrishScottishSeminoleSenegaleseSerbianShoshoneSierra LeoneanSiouxSlavicSlovakSloveneSomaliSouth AfricanSouth AmericanSouth American IndianSoviet UnionSpaniardSpanishSpanish AmericanSpanish American IndianSri LankanSubsaharan AfricanSudaneseSwedishSwissSyrianTaiwaneseThaiTlingit-HaidaTohono O'OdhamTonganTrinidadian and TobagonianTsimshianTurkishU.S. Virgin IslanderUgandanUkrainianUruguayanUteVenezuelanVietnameseWelshWest IndianYakamaYaquiYugoslavianYumanYup'ikZimbabwean
Immigration
NonimmigrantsImmigrantsAfghanistanAfricaAlbaniaArgentinaArmeniaAsiaAustraliaAustriaBahamasBangladeshBarbadosBelarusBelgiumBelizeBoliviaBosnia and HerzegovinaBrazilBulgariaBurma/MyanmarCabo VerdeCambodiaCameroonCanadaCaribbeanCentral AmericaChileChinaColombiaCongoCosta RicaCroatiaCubaCzechoslovakiaDenmarkDominicaDominican RepublicEastern AfricaEastern AsiaEastern EuropeEcuadorEgyptEl SalvadorEnglandEritreaEthiopiaEuropeFijiFranceGermanyGhanaGreeceGrenadaGuatemalaGuyanaHaitiHondurasHong KongHungaryIndiaIndonesiaIranIraqIrelandIsraelItalyJamaicaJapanJordanKazakhstanKenyaKoreaKuwaitLaosLatin AmericaLatviaLebanonLiberiaLithuaniaMalaysiaMexicoMicronesiaMiddle AfricaMoldovaMoroccoNepalNetherlandsNicaraguaNigeriaNorth AmericaNorth MacedoniaNorthern AfricaNorthern EuropeNorwayOceaniaPakistanPanamaPeruPhilippinesPolandPortugalRomaniaRussiaSaudi ArabiaScotlandSenegalSerbiaSierra LeoneSingaporeSomaliaSouth AfricaSouth AmericaSouth Central AsiaSouth Eastern AsiaSouthern EuropeSpainSri LankaSt. Vincent and the GrenadinesSudanSwedenSwitzerlandSyriaTaiwanThailandTrinidad and TobagoTurkeyUgandaUkraineUruguayUzbekistanVenezuelaVietnamWest IndiesWestern AfricaWestern AsiaWestern EuropeYemenZaireZimbabweAzores
Self-Care Disability
Income
Poverty
Unemployment
Labor Participation
Family Structure
Vehicle Availability
Education Level
Disability

Self-Care Disability Comparison

Bolivians

Immigrants from Western Africa

Exceptional
Poor
2.2%
SELF-CARE DISABILITY
100.0/ 100
METRIC RATING
8th/ 347
METRIC RANK
2.5%
SELF-CARE DISABILITY
13.3/ 100
METRIC RATING
200th/ 347
METRIC RANK

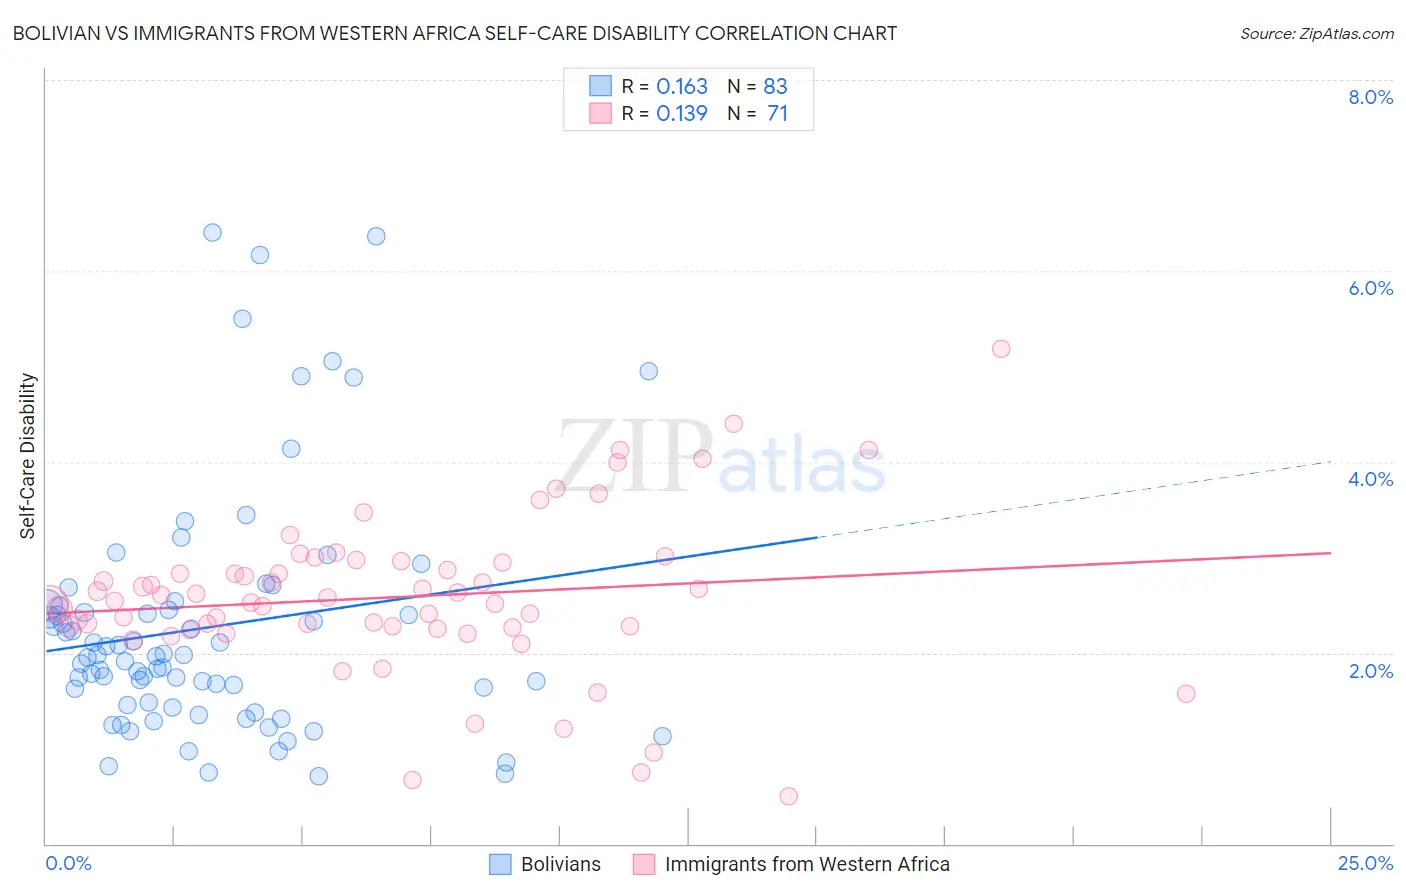
Bolivian vs Immigrants from Western Africa Self-Care Disability Correlation Chart

The statistical analysis conducted on geographies consisting of 184,600,652 people shows a poor positive correlation between the proportion of Bolivians and percentage of population with self-care disability in the United States with a correlation coefficient (R) of 0.163 and weighted average of 2.2%. Similarly, the statistical analysis conducted on geographies consisting of 357,358,098 people shows a poor positive correlation between the proportion of Immigrants from Western Africa and percentage of population with self-care disability in the United States with a correlation coefficient (R) of 0.139 and weighted average of 2.5%, a difference of 16.7%.
Bolivian vs Immigrants from Western Africa Self-Care Disability

Self-Care Disability Correlation Summary

MeasurementBolivianImmigrants from Western Africa
Minimum0.71%0.50%
Maximum6.4%5.2%
Range5.7%4.7%
Mean2.3%2.6%
Median2.0%2.5%
Interquartile 25% (IQ1)1.5%2.3%
Interquartile 75% (IQ3)2.5%3.0%
Interquartile Range (IQR)1.0%0.69%
Standard Deviation (Sample)1.3%0.83%
Standard Deviation (Population)1.3%0.82%

Similar Demographics by Self-Care Disability

Demographics Similar to Bolivians by Self-Care Disability

In terms of self-care disability, the demographic groups most similar to Bolivians are Immigrants from Bolivia (2.2%, a difference of 0.050%), Immigrants from Nepal (2.2%, a difference of 0.14%), Filipino (2.2%, a difference of 0.26%), Zimbabwean (2.2%, a difference of 0.51%), and Sudanese (2.2%, a difference of 1.4%).
DemographicsRating | RankSelf-Care Disability
Yup'ik
100.0
/100
|
#1
Exceptional
1.9%
Immigrants | India
100.0
/100
|
#2
Exceptional
2.0%
Thais
100.0
/100
|
#3
Exceptional
2.1%
Immigrants | Singapore
100.0
/100
|
#4
Exceptional
2.1%
Zimbabweans
100.0
/100
|
#5
Exceptional
2.2%
Filipinos
100.0
/100
|
#6
Exceptional
2.2%
Immigrants | Bolivia
100.0
/100
|
#7
Exceptional
2.2%
Bolivians
100.0
/100
|
#8
Exceptional
2.2%
Immigrants | Nepal
100.0
/100
|
#9
Exceptional
2.2%
Sudanese
100.0
/100
|
#10
Exceptional
2.2%
Immigrants | South Central Asia
100.0
/100
|
#11
Exceptional
2.2%
Immigrants | Ethiopia
100.0
/100
|
#12
Exceptional
2.2%
Ethiopians
100.0
/100
|
#13
Exceptional
2.2%
Luxembourgers
100.0
/100
|
#14
Exceptional
2.2%
Okinawans
100.0
/100
|
#15
Exceptional
2.2%

Demographics Similar to Immigrants from Western Africa by Self-Care Disability

In terms of self-care disability, the demographic groups most similar to Immigrants from Western Africa are Immigrants from South Eastern Asia (2.5%, a difference of 0.030%), Slovak (2.5%, a difference of 0.070%), Immigrants from Lebanon (2.5%, a difference of 0.090%), Immigrants from Ghana (2.5%, a difference of 0.14%), and Immigrants from Bahamas (2.5%, a difference of 0.14%).
DemographicsRating | RankSelf-Care Disability
Ukrainians
21.4
/100
|
#193
Fair
2.5%
Immigrants | Germany
17.9
/100
|
#194
Poor
2.5%
Immigrants | Southern Europe
15.6
/100
|
#195
Poor
2.5%
Koreans
15.5
/100
|
#196
Poor
2.5%
Crow
15.2
/100
|
#197
Poor
2.5%
Immigrants | Immigrants
15.0
/100
|
#198
Poor
2.5%
Immigrants | Ghana
14.7
/100
|
#199
Poor
2.5%
Immigrants | Western Africa
13.3
/100
|
#200
Poor
2.5%
Immigrants | South Eastern Asia
12.9
/100
|
#201
Poor
2.5%
Slovaks
12.6
/100
|
#202
Poor
2.5%
Immigrants | Lebanon
12.4
/100
|
#203
Poor
2.5%
Immigrants | Bahamas
11.9
/100
|
#204
Poor
2.5%
Immigrants | Russia
11.0
/100
|
#205
Poor
2.5%
Alaskan Athabascans
10.4
/100
|
#206
Poor
2.5%
French
9.9
/100
|
#207
Tragic
2.5%