Immigrants from Vietnam vs Iraqi Disability Age 18 to 34
COMPARE
Immigrants from Vietnam
Iraqi
Disability Age 18 to 34
Disability Age 18 to 34 Comparison
Immigrants from Vietnam
Iraqis
6.2%
DISABILITY AGE 18 TO 34
97.7/ 100
METRIC RATING
90th/ 347
METRIC RANK
6.7%
DISABILITY AGE 18 TO 34
37.4/ 100
METRIC RATING
184th/ 347
METRIC RANK
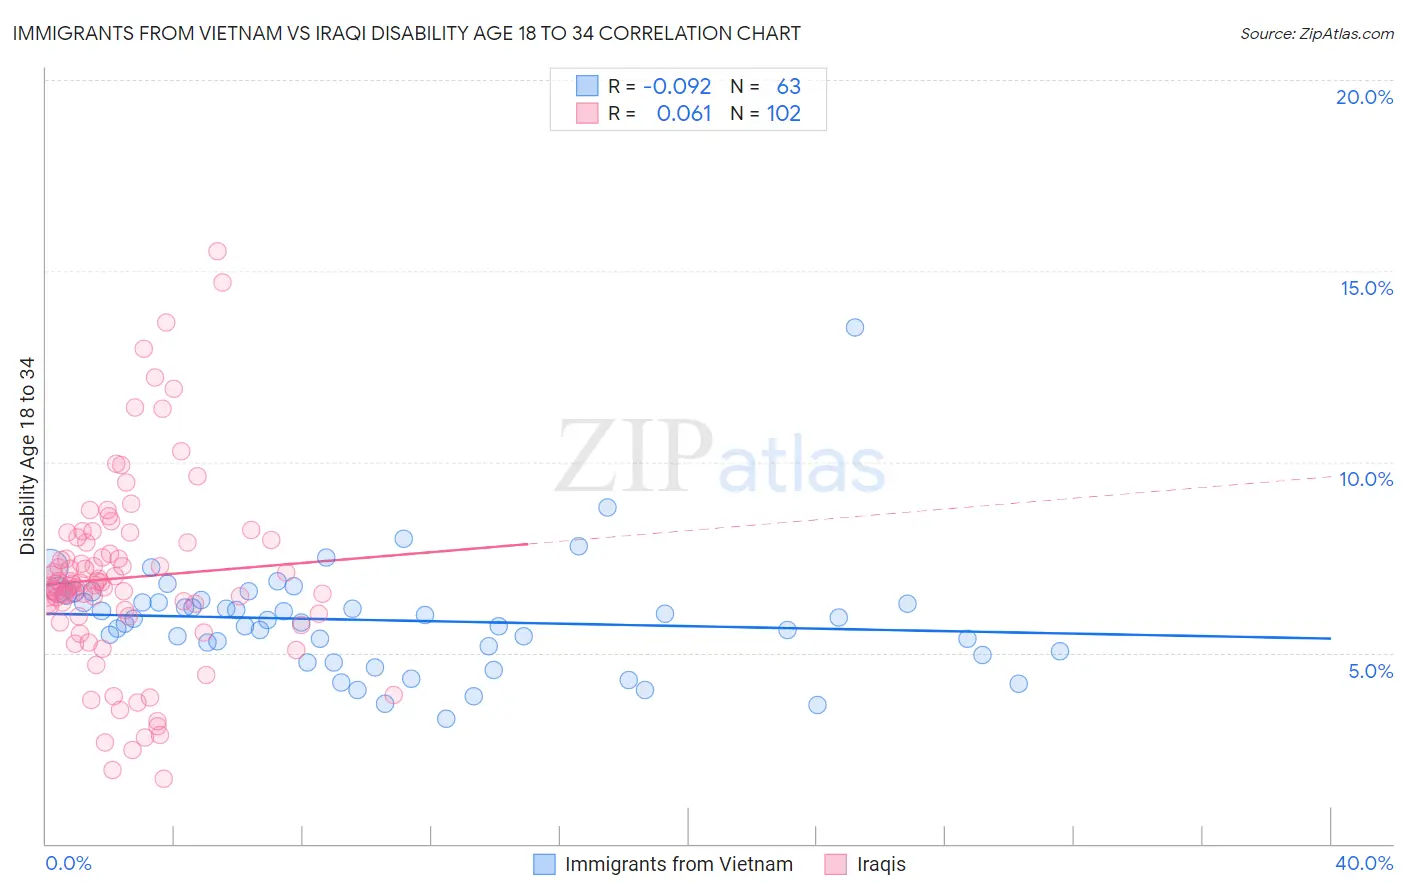
Immigrants from Vietnam vs Iraqi Disability Age 18 to 34 Correlation Chart
The statistical analysis conducted on geographies consisting of 404,172,069 people shows a slight negative correlation between the proportion of Immigrants from Vietnam and percentage of population with a disability between the ages 18 and 35 in the United States with a correlation coefficient (R) of -0.092 and weighted average of 6.2%. Similarly, the statistical analysis conducted on geographies consisting of 170,587,063 people shows a slight positive correlation between the proportion of Iraqis and percentage of population with a disability between the ages 18 and 35 in the United States with a correlation coefficient (R) of 0.061 and weighted average of 6.7%, a difference of 7.9%.
Disability Age 18 to 34 Correlation Summary
| Measurement | Immigrants from Vietnam | Iraqi |
| Minimum | 3.3% | 1.7% |
| Maximum | 13.5% | 15.5% |
| Range | 10.2% | 13.8% |
| Mean | 5.9% | 7.0% |
| Median | 5.9% | 6.8% |
| Interquartile 25% (IQ1) | 5.0% | 6.0% |
| Interquartile 75% (IQ3) | 6.4% | 7.9% |
| Interquartile Range (IQR) | 1.3% | 1.9% |
| Standard Deviation (Sample) | 1.5% | 2.5% |
| Standard Deviation (Population) | 1.5% | 2.5% |
Similar Demographics by Disability Age 18 to 34
Demographics Similar to Immigrants from Vietnam by Disability Age 18 to 34
In terms of disability age 18 to 34, the demographic groups most similar to Immigrants from Vietnam are Turkish (6.2%, a difference of 0.040%), Immigrants from Philippines (6.2%, a difference of 0.080%), Cambodian (6.2%, a difference of 0.10%), Jordanian (6.2%, a difference of 0.12%), and Immigrants from Eastern Europe (6.2%, a difference of 0.13%).
| Demographics | Rating | Rank | Disability Age 18 to 34 |
| Barbadians | 98.3 /100 | #83 | Exceptional 6.1% |
| Israelis | 98.3 /100 | #84 | Exceptional 6.1% |
| Immigrants | Ireland | 98.2 /100 | #85 | Exceptional 6.1% |
| Immigrants | Kuwait | 98.0 /100 | #86 | Exceptional 6.2% |
| Immigrants | Eastern Europe | 97.9 /100 | #87 | Exceptional 6.2% |
| Cambodians | 97.8 /100 | #88 | Exceptional 6.2% |
| Turks | 97.8 /100 | #89 | Exceptional 6.2% |
| Immigrants | Vietnam | 97.7 /100 | #90 | Exceptional 6.2% |
| Immigrants | Philippines | 97.6 /100 | #91 | Exceptional 6.2% |
| Jordanians | 97.6 /100 | #92 | Exceptional 6.2% |
| Immigrants | Immigrants | 97.6 /100 | #93 | Exceptional 6.2% |
| Immigrants | Kazakhstan | 97.5 /100 | #94 | Exceptional 6.2% |
| Central Americans | 97.5 /100 | #95 | Exceptional 6.2% |
| Immigrants | Uruguay | 97.4 /100 | #96 | Exceptional 6.2% |
| Uruguayans | 97.3 /100 | #97 | Exceptional 6.2% |
Demographics Similar to Iraqis by Disability Age 18 to 34
In terms of disability age 18 to 34, the demographic groups most similar to Iraqis are Immigrants from Iraq (6.7%, a difference of 0.0%), U.S. Virgin Islander (6.7%, a difference of 0.090%), Immigrants from Oceania (6.7%, a difference of 0.15%), Yup'ik (6.7%, a difference of 0.15%), and Immigrants from Austria (6.6%, a difference of 0.16%).
| Demographics | Rating | Rank | Disability Age 18 to 34 |
| Syrians | 44.3 /100 | #177 | Average 6.6% |
| Nigerians | 43.7 /100 | #178 | Average 6.6% |
| Immigrants | Ghana | 42.1 /100 | #179 | Average 6.6% |
| Immigrants | Austria | 39.6 /100 | #180 | Fair 6.6% |
| Romanians | 39.5 /100 | #181 | Fair 6.6% |
| U.S. Virgin Islanders | 38.6 /100 | #182 | Fair 6.7% |
| Immigrants | Iraq | 37.4 /100 | #183 | Fair 6.7% |
| Iraqis | 37.4 /100 | #184 | Fair 6.7% |
| Immigrants | Oceania | 35.4 /100 | #185 | Fair 6.7% |
| Yup'ik | 35.3 /100 | #186 | Fair 6.7% |
| Maltese | 34.8 /100 | #187 | Fair 6.7% |
| Immigrants | Cameroon | 34.5 /100 | #188 | Fair 6.7% |
| Pakistanis | 33.7 /100 | #189 | Fair 6.7% |
| Immigrants | Zimbabwe | 33.6 /100 | #190 | Fair 6.7% |
| Immigrants | Eastern Africa | 33.2 /100 | #191 | Fair 6.7% |