Australian vs Immigrants from Northern Africa Disability Age 18 to 34
COMPARE
Australian
Immigrants from Northern Africa
Disability Age 18 to 34
Disability Age 18 to 34 Comparison
Australians
Immigrants from Northern Africa
6.8%
DISABILITY AGE 18 TO 34
19.4/ 100
METRIC RATING
198th/ 347
METRIC RANK
6.1%
DISABILITY AGE 18 TO 34
98.4/ 100
METRIC RATING
82nd/ 347
METRIC RANK
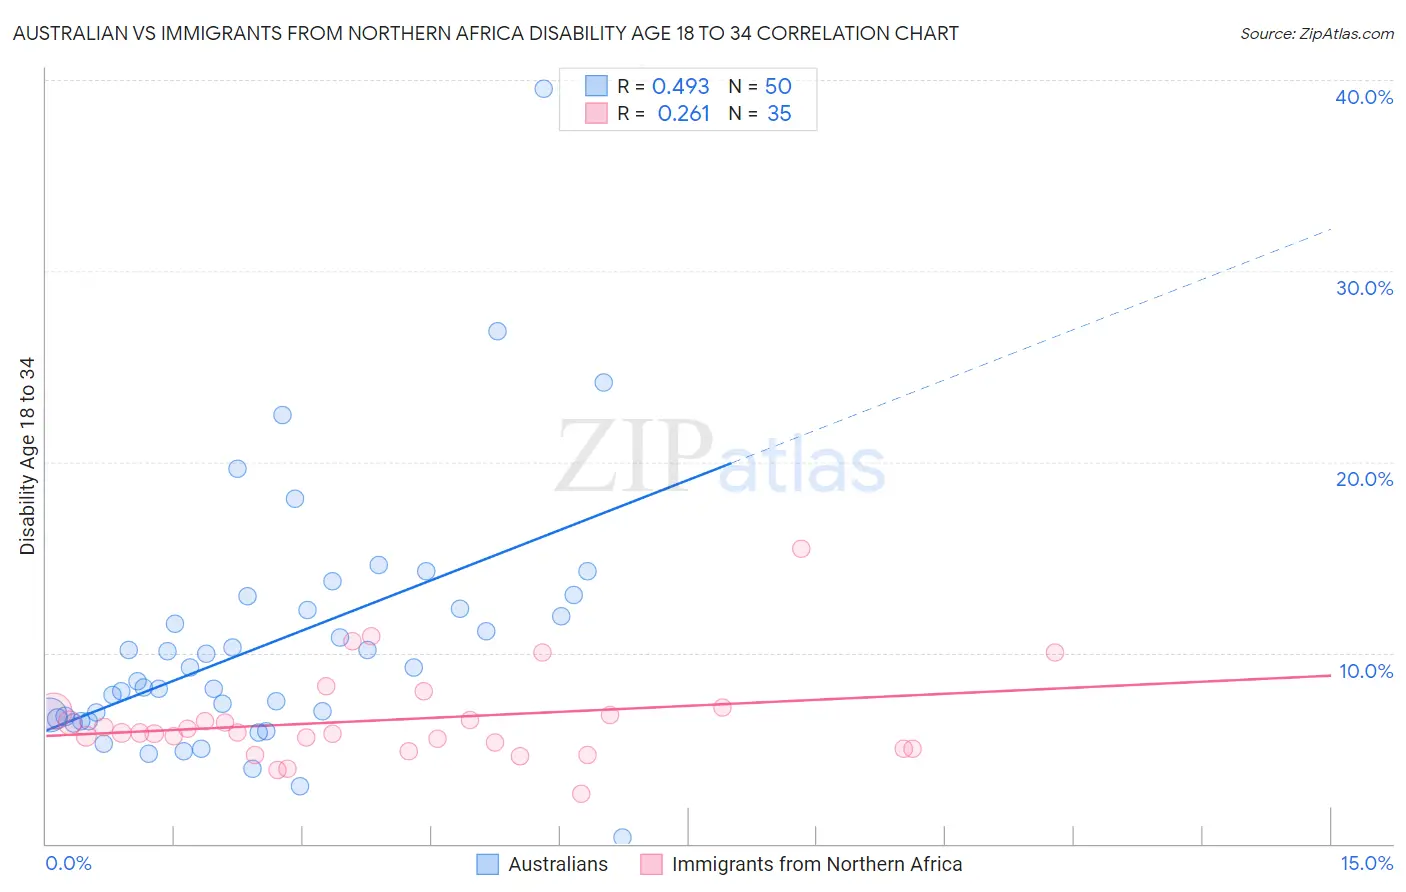
Australian vs Immigrants from Northern Africa Disability Age 18 to 34 Correlation Chart
The statistical analysis conducted on geographies consisting of 223,842,296 people shows a moderate positive correlation between the proportion of Australians and percentage of population with a disability between the ages 18 and 35 in the United States with a correlation coefficient (R) of 0.493 and weighted average of 6.8%. Similarly, the statistical analysis conducted on geographies consisting of 320,800,058 people shows a weak positive correlation between the proportion of Immigrants from Northern Africa and percentage of population with a disability between the ages 18 and 35 in the United States with a correlation coefficient (R) of 0.261 and weighted average of 6.1%, a difference of 10.3%.
Disability Age 18 to 34 Correlation Summary
| Measurement | Australian | Immigrants from Northern Africa |
| Minimum | 0.32% | 2.6% |
| Maximum | 39.5% | 15.5% |
| Range | 39.2% | 12.8% |
| Mean | 10.6% | 6.5% |
| Median | 8.9% | 5.8% |
| Interquartile 25% (IQ1) | 6.6% | 5.0% |
| Interquartile 75% (IQ3) | 12.3% | 6.9% |
| Interquartile Range (IQR) | 5.7% | 1.9% |
| Standard Deviation (Sample) | 6.7% | 2.4% |
| Standard Deviation (Population) | 6.6% | 2.4% |
Similar Demographics by Disability Age 18 to 34
Demographics Similar to Australians by Disability Age 18 to 34
In terms of disability age 18 to 34, the demographic groups most similar to Australians are Estonian (6.8%, a difference of 0.13%), Kenyan (6.8%, a difference of 0.13%), Immigrants from Netherlands (6.7%, a difference of 0.16%), Sierra Leonean (6.8%, a difference of 0.22%), and Mexican American Indian (6.7%, a difference of 0.29%).
| Demographics | Rating | Rank | Disability Age 18 to 34 |
| Immigrants | Eastern Africa | 33.2 /100 | #191 | Fair 6.7% |
| Immigrants | Western Africa | 28.3 /100 | #192 | Fair 6.7% |
| Immigrants | Uganda | 25.1 /100 | #193 | Fair 6.7% |
| Immigrants | Sudan | 24.9 /100 | #194 | Fair 6.7% |
| Mexican American Indians | 22.3 /100 | #195 | Fair 6.7% |
| Immigrants | Netherlands | 21.0 /100 | #196 | Fair 6.7% |
| Estonians | 20.6 /100 | #197 | Fair 6.8% |
| Australians | 19.4 /100 | #198 | Poor 6.8% |
| Kenyans | 18.3 /100 | #199 | Poor 6.8% |
| Sierra Leoneans | 17.5 /100 | #200 | Poor 6.8% |
| Greeks | 16.1 /100 | #201 | Poor 6.8% |
| Panamanians | 15.8 /100 | #202 | Poor 6.8% |
| Hispanics or Latinos | 13.8 /100 | #203 | Poor 6.8% |
| Immigrants | Bosnia and Herzegovina | 13.6 /100 | #204 | Poor 6.8% |
| Lebanese | 13.3 /100 | #205 | Poor 6.8% |
Demographics Similar to Immigrants from Northern Africa by Disability Age 18 to 34
In terms of disability age 18 to 34, the demographic groups most similar to Immigrants from Northern Africa are Barbadian (6.1%, a difference of 0.060%), Israeli (6.1%, a difference of 0.10%), Immigrants from Ireland (6.1%, a difference of 0.17%), Immigrants from Australia (6.1%, a difference of 0.18%), and Immigrants from Chile (6.1%, a difference of 0.22%).
| Demographics | Rating | Rank | Disability Age 18 to 34 |
| Immigrants | Turkey | 99.1 /100 | #75 | Exceptional 6.1% |
| Immigrants | Western Asia | 98.9 /100 | #76 | Exceptional 6.1% |
| Immigrants | Russia | 98.9 /100 | #77 | Exceptional 6.1% |
| Assyrians/Chaldeans/Syriacs | 98.9 /100 | #78 | Exceptional 6.1% |
| Afghans | 98.7 /100 | #79 | Exceptional 6.1% |
| Immigrants | Chile | 98.5 /100 | #80 | Exceptional 6.1% |
| Immigrants | Australia | 98.5 /100 | #81 | Exceptional 6.1% |
| Immigrants | Northern Africa | 98.4 /100 | #82 | Exceptional 6.1% |
| Barbadians | 98.3 /100 | #83 | Exceptional 6.1% |
| Israelis | 98.3 /100 | #84 | Exceptional 6.1% |
| Immigrants | Ireland | 98.2 /100 | #85 | Exceptional 6.1% |
| Immigrants | Kuwait | 98.0 /100 | #86 | Exceptional 6.2% |
| Immigrants | Eastern Europe | 97.9 /100 | #87 | Exceptional 6.2% |
| Cambodians | 97.8 /100 | #88 | Exceptional 6.2% |
| Turks | 97.8 /100 | #89 | Exceptional 6.2% |