Alaskan Athabascan vs Immigrants from Somalia Ambulatory Disability
COMPARE
Alaskan Athabascan
Immigrants from Somalia
Ambulatory Disability
Ambulatory Disability Comparison
Alaskan Athabascans
Immigrants from Somalia
6.9%
AMBULATORY DISABILITY
0.0/ 100
METRIC RATING
296th/ 347
METRIC RANK
5.8%
AMBULATORY DISABILITY
98.3/ 100
METRIC RATING
97th/ 347
METRIC RANK
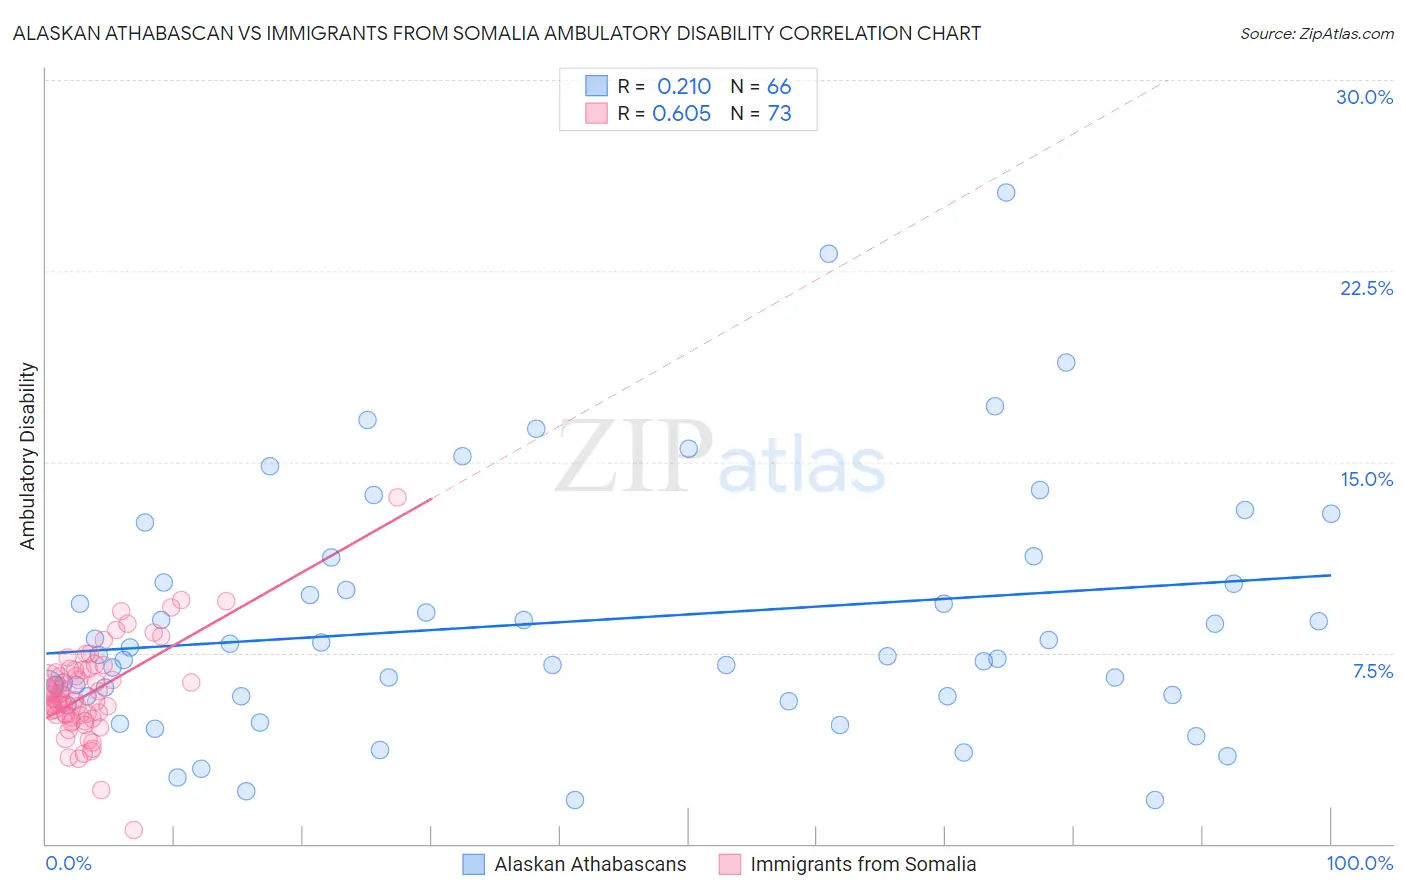
Alaskan Athabascan vs Immigrants from Somalia Ambulatory Disability Correlation Chart
The statistical analysis conducted on geographies consisting of 45,819,153 people shows a weak positive correlation between the proportion of Alaskan Athabascans and percentage of population with ambulatory disability in the United States with a correlation coefficient (R) of 0.210 and weighted average of 6.9%. Similarly, the statistical analysis conducted on geographies consisting of 92,104,966 people shows a significant positive correlation between the proportion of Immigrants from Somalia and percentage of population with ambulatory disability in the United States with a correlation coefficient (R) of 0.605 and weighted average of 5.8%, a difference of 19.6%.
Ambulatory Disability Correlation Summary
| Measurement | Alaskan Athabascan | Immigrants from Somalia |
| Minimum | 1.7% | 0.52% |
| Maximum | 25.6% | 13.6% |
| Range | 23.9% | 13.1% |
| Mean | 8.7% | 5.9% |
| Median | 7.4% | 5.7% |
| Interquartile 25% (IQ1) | 5.8% | 5.0% |
| Interquartile 75% (IQ3) | 10.3% | 6.8% |
| Interquartile Range (IQR) | 4.5% | 1.8% |
| Standard Deviation (Sample) | 4.9% | 1.9% |
| Standard Deviation (Population) | 4.8% | 1.9% |
Similar Demographics by Ambulatory Disability
Demographics Similar to Alaskan Athabascans by Ambulatory Disability
In terms of ambulatory disability, the demographic groups most similar to Alaskan Athabascans are French American Indian (6.9%, a difference of 0.17%), Immigrants from Grenada (6.9%, a difference of 0.18%), Crow (6.9%, a difference of 0.23%), Cape Verdean (6.9%, a difference of 0.30%), and Puget Sound Salish (6.9%, a difference of 0.31%).
| Demographics | Rating | Rank | Ambulatory Disability |
| Immigrants | Dominica | 0.0 /100 | #289 | Tragic 6.9% |
| Scotch-Irish | 0.0 /100 | #290 | Tragic 6.9% |
| West Indians | 0.0 /100 | #291 | Tragic 6.9% |
| Cheyenne | 0.0 /100 | #292 | Tragic 6.9% |
| Immigrants | St. Vincent and the Grenadines | 0.0 /100 | #293 | Tragic 6.9% |
| Cape Verdeans | 0.0 /100 | #294 | Tragic 6.9% |
| Crow | 0.0 /100 | #295 | Tragic 6.9% |
| Alaskan Athabascans | 0.0 /100 | #296 | Tragic 6.9% |
| French American Indians | 0.0 /100 | #297 | Tragic 6.9% |
| Immigrants | Grenada | 0.0 /100 | #298 | Tragic 6.9% |
| Puget Sound Salish | 0.0 /100 | #299 | Tragic 6.9% |
| Marshallese | 0.0 /100 | #300 | Tragic 6.9% |
| British West Indians | 0.0 /100 | #301 | Tragic 7.0% |
| Immigrants | Armenia | 0.0 /100 | #302 | Tragic 7.0% |
| Africans | 0.0 /100 | #303 | Tragic 7.0% |
Demographics Similar to Immigrants from Somalia by Ambulatory Disability
In terms of ambulatory disability, the demographic groups most similar to Immigrants from Somalia are Immigrants from Lebanon (5.8%, a difference of 0.020%), Salvadoran (5.8%, a difference of 0.040%), Immigrants from El Salvador (5.8%, a difference of 0.060%), Kenyan (5.8%, a difference of 0.10%), and Immigrants from Northern Europe (5.8%, a difference of 0.11%).
| Demographics | Rating | Rank | Ambulatory Disability |
| Australians | 98.8 /100 | #90 | Exceptional 5.8% |
| Immigrants | Sudan | 98.8 /100 | #91 | Exceptional 5.8% |
| Immigrants | Sierra Leone | 98.6 /100 | #92 | Exceptional 5.8% |
| Immigrants | Denmark | 98.6 /100 | #93 | Exceptional 5.8% |
| Kenyans | 98.4 /100 | #94 | Exceptional 5.8% |
| Immigrants | El Salvador | 98.4 /100 | #95 | Exceptional 5.8% |
| Salvadorans | 98.4 /100 | #96 | Exceptional 5.8% |
| Immigrants | Somalia | 98.3 /100 | #97 | Exceptional 5.8% |
| Immigrants | Lebanon | 98.3 /100 | #98 | Exceptional 5.8% |
| Immigrants | Northern Europe | 98.2 /100 | #99 | Exceptional 5.8% |
| Immigrants | Serbia | 97.9 /100 | #100 | Exceptional 5.8% |
| Immigrants | South America | 97.9 /100 | #101 | Exceptional 5.8% |
| Immigrants | Kenya | 97.8 /100 | #102 | Exceptional 5.8% |
| Immigrants | Romania | 97.7 /100 | #103 | Exceptional 5.8% |
| New Zealanders | 97.6 /100 | #104 | Exceptional 5.8% |