Arapaho vs Crow Disability Age 65 to 74
COMPARE
Arapaho
Crow
Disability Age 65 to 74
Disability Age 65 to 74 Comparison
Arapaho
Crow
28.1%
DISABILITY AGE 65 TO 74
0.0/ 100
METRIC RATING
319th/ 347
METRIC RANK
27.9%
DISABILITY AGE 65 TO 74
0.0/ 100
METRIC RATING
316th/ 347
METRIC RANK
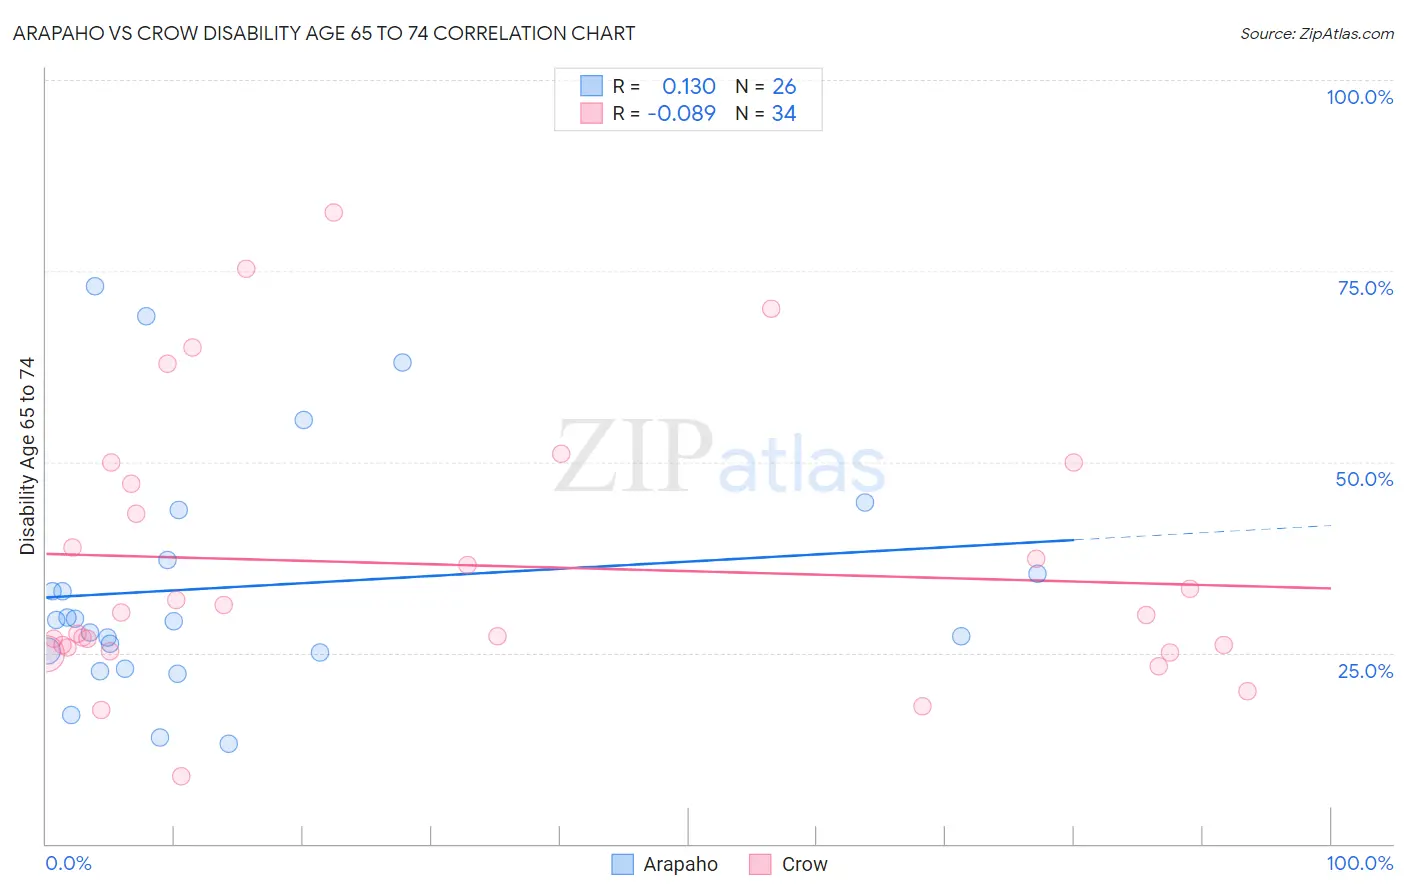
Arapaho vs Crow Disability Age 65 to 74 Correlation Chart
The statistical analysis conducted on geographies consisting of 29,768,926 people shows a poor positive correlation between the proportion of Arapaho and percentage of population with a disability between the ages 65 and 75 in the United States with a correlation coefficient (R) of 0.130 and weighted average of 28.1%. Similarly, the statistical analysis conducted on geographies consisting of 59,176,380 people shows a slight negative correlation between the proportion of Crow and percentage of population with a disability between the ages 65 and 75 in the United States with a correlation coefficient (R) of -0.089 and weighted average of 27.9%, a difference of 0.54%.
Disability Age 65 to 74 Correlation Summary
| Measurement | Arapaho | Crow |
| Minimum | 13.0% | 8.8% |
| Maximum | 72.9% | 82.6% |
| Range | 59.9% | 73.8% |
| Mean | 33.6% | 36.5% |
| Median | 29.2% | 30.2% |
| Interquartile 25% (IQ1) | 25.0% | 25.8% |
| Interquartile 75% (IQ3) | 37.2% | 47.2% |
| Interquartile Range (IQR) | 12.2% | 21.4% |
| Standard Deviation (Sample) | 15.8% | 17.6% |
| Standard Deviation (Population) | 15.5% | 17.4% |
Demographics Similar to Arapaho and Crow by Disability Age 65 to 74
In terms of disability age 65 to 74, the demographic groups most similar to Arapaho are Nepalese (28.0%, a difference of 0.23%), Cherokee (28.2%, a difference of 0.39%), Immigrants from Armenia (28.0%, a difference of 0.45%), Cajun (27.9%, a difference of 0.58%), and Comanche (28.3%, a difference of 0.89%). Similarly, the demographic groups most similar to Crow are Cajun (27.9%, a difference of 0.040%), Immigrants from Armenia (28.0%, a difference of 0.090%), Nepalese (28.0%, a difference of 0.31%), Chippewa (27.8%, a difference of 0.52%), and Paiute (27.8%, a difference of 0.53%).
| Demographics | Rating | Rank | Disability Age 65 to 74 |
| Ute | 0.0 /100 | #307 | Tragic 27.3% |
| Sioux | 0.0 /100 | #308 | Tragic 27.3% |
| Yaqui | 0.0 /100 | #309 | Tragic 27.4% |
| Shoshone | 0.0 /100 | #310 | Tragic 27.4% |
| Menominee | 0.0 /100 | #311 | Tragic 27.4% |
| Osage | 0.0 /100 | #312 | Tragic 27.5% |
| Paiute | 0.0 /100 | #313 | Tragic 27.8% |
| Chippewa | 0.0 /100 | #314 | Tragic 27.8% |
| Cajuns | 0.0 /100 | #315 | Tragic 27.9% |
| Crow | 0.0 /100 | #316 | Tragic 27.9% |
| Immigrants | Armenia | 0.0 /100 | #317 | Tragic 28.0% |
| Nepalese | 0.0 /100 | #318 | Tragic 28.0% |
| Arapaho | 0.0 /100 | #319 | Tragic 28.1% |
| Cherokee | 0.0 /100 | #320 | Tragic 28.2% |
| Comanche | 0.0 /100 | #321 | Tragic 28.3% |
| Aleuts | 0.0 /100 | #322 | Tragic 28.4% |
| Puerto Ricans | 0.0 /100 | #323 | Tragic 29.1% |
| Seminole | 0.0 /100 | #324 | Tragic 29.4% |
| Dutch West Indians | 0.0 /100 | #325 | Tragic 29.6% |
| Yakama | 0.0 /100 | #326 | Tragic 29.6% |
| Apache | 0.0 /100 | #327 | Tragic 29.7% |