Greek vs Egyptian Disability Age 65 to 74
COMPARE
Greek
Egyptian
Disability Age 65 to 74
Disability Age 65 to 74 Comparison
Greeks
Egyptians
21.8%
DISABILITY AGE 65 TO 74
99.0/ 100
METRIC RATING
76th/ 347
METRIC RANK
21.6%
DISABILITY AGE 65 TO 74
99.5/ 100
METRIC RATING
61st/ 347
METRIC RANK
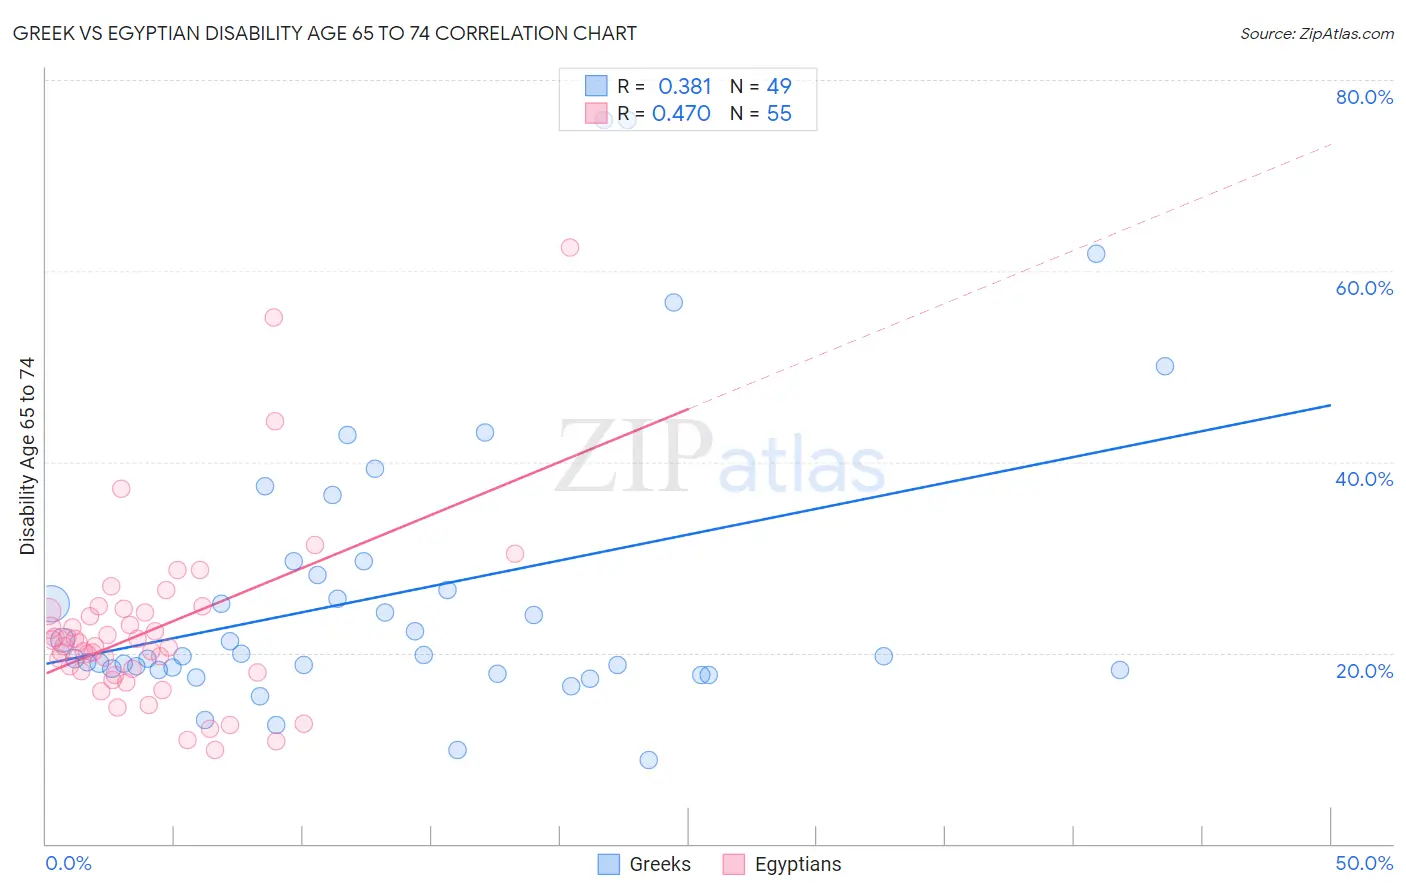
Greek vs Egyptian Disability Age 65 to 74 Correlation Chart
The statistical analysis conducted on geographies consisting of 481,507,065 people shows a mild positive correlation between the proportion of Greeks and percentage of population with a disability between the ages 65 and 75 in the United States with a correlation coefficient (R) of 0.381 and weighted average of 21.8%. Similarly, the statistical analysis conducted on geographies consisting of 276,538,770 people shows a moderate positive correlation between the proportion of Egyptians and percentage of population with a disability between the ages 65 and 75 in the United States with a correlation coefficient (R) of 0.470 and weighted average of 21.6%, a difference of 0.96%.
Disability Age 65 to 74 Correlation Summary
| Measurement | Greek | Egyptian |
| Minimum | 8.8% | 9.8% |
| Maximum | 75.9% | 62.5% |
| Range | 67.1% | 52.7% |
| Mean | 26.3% | 22.4% |
| Median | 19.6% | 20.7% |
| Interquartile 25% (IQ1) | 18.2% | 17.9% |
| Interquartile 75% (IQ3) | 28.9% | 24.4% |
| Interquartile Range (IQR) | 10.7% | 6.5% |
| Standard Deviation (Sample) | 15.2% | 9.5% |
| Standard Deviation (Population) | 15.1% | 9.4% |
Demographics Similar to Greeks and Egyptians by Disability Age 65 to 74
In terms of disability age 65 to 74, the demographic groups most similar to Greeks are Mongolian (21.8%, a difference of 0.010%), Cambodian (21.8%, a difference of 0.030%), Immigrants from Venezuela (21.8%, a difference of 0.040%), Immigrants from Poland (21.8%, a difference of 0.060%), and Immigrants from Eastern Europe (21.8%, a difference of 0.11%). Similarly, the demographic groups most similar to Egyptians are Immigrants from North Macedonia (21.6%, a difference of 0.030%), Carpatho Rusyn (21.6%, a difference of 0.030%), Zimbabwean (21.5%, a difference of 0.050%), Immigrants from Pakistan (21.5%, a difference of 0.090%), and Immigrants from Europe (21.6%, a difference of 0.13%).
| Demographics | Rating | Rank | Disability Age 65 to 74 |
| Immigrants | Pakistan | 99.5 /100 | #58 | Exceptional 21.5% |
| Zimbabweans | 99.5 /100 | #59 | Exceptional 21.5% |
| Immigrants | North Macedonia | 99.5 /100 | #60 | Exceptional 21.6% |
| Egyptians | 99.5 /100 | #61 | Exceptional 21.6% |
| Carpatho Rusyns | 99.5 /100 | #62 | Exceptional 21.6% |
| Immigrants | Europe | 99.4 /100 | #63 | Exceptional 21.6% |
| Immigrants | Latvia | 99.4 /100 | #64 | Exceptional 21.6% |
| Immigrants | Russia | 99.4 /100 | #65 | Exceptional 21.6% |
| Maltese | 99.4 /100 | #66 | Exceptional 21.6% |
| Immigrants | South Africa | 99.3 /100 | #67 | Exceptional 21.7% |
| Immigrants | Scotland | 99.3 /100 | #68 | Exceptional 21.7% |
| Immigrants | Egypt | 99.2 /100 | #69 | Exceptional 21.7% |
| Chinese | 99.2 /100 | #70 | Exceptional 21.7% |
| Immigrants | Belarus | 99.2 /100 | #71 | Exceptional 21.7% |
| Immigrants | Hungary | 99.2 /100 | #72 | Exceptional 21.7% |
| Immigrants | Venezuela | 99.0 /100 | #73 | Exceptional 21.8% |
| Cambodians | 99.0 /100 | #74 | Exceptional 21.8% |
| Mongolians | 99.0 /100 | #75 | Exceptional 21.8% |
| Greeks | 99.0 /100 | #76 | Exceptional 21.8% |
| Immigrants | Poland | 99.0 /100 | #77 | Exceptional 21.8% |
| Immigrants | Eastern Europe | 99.0 /100 | #78 | Exceptional 21.8% |