Zip Codes with the Highest Percentage of Households with Income Above $200,000 in Austin, TX
RELATED REPORTS & OPTIONS
Household Income | $200k+
Austin
Compare Zip Codes
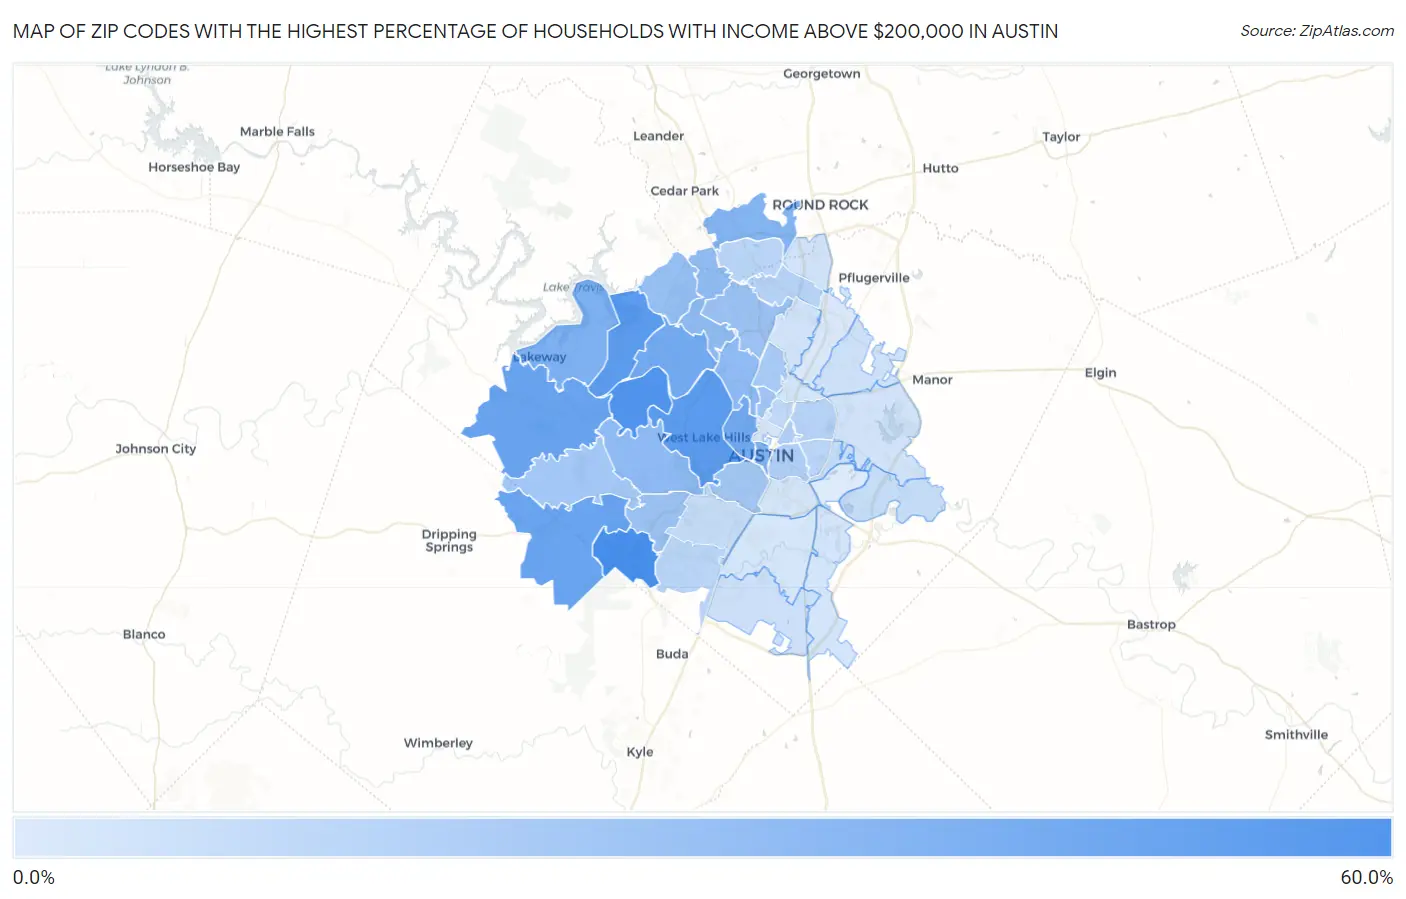
Map of Zip Codes with the Highest Percentage of Households with Income Above $200,000 in Austin
3.7%
51.7%
Zip Codes with the Highest Percentage of Households with Income Above $200,000 in Austin, TX
| Zip Code | Households with Income > $200k | vs State | vs National | |
| 1. | 78739 | 51.7% | 10.6%(+41.1)#11 | 11.4%(+40.3)#237 |
| 2. | 78733 | 48.4% | 10.6%(+37.8)#13 | 11.4%(+37.0)#316 |
| 3. | 78746 | 44.1% | 10.6%(+33.5)#18 | 11.4%(+32.7)#457 |
| 4. | 78732 | 43.5% | 10.6%(+32.9)#19 | 11.4%(+32.1)#478 |
| 5. | 78738 | 39.7% | 10.6%(+29.1)#24 | 11.4%(+28.3)#661 |
| 6. | 78737 | 39.2% | 10.6%(+28.6)#28 | 11.4%(+27.8)#690 |
| 7. | 78730 | 36.0% | 10.6%(+25.4)#36 | 11.4%(+24.6)#905 |
| 8. | 78703 | 35.5% | 10.6%(+24.9)#38 | 11.4%(+24.1)#940 |
| 9. | 78734 | 31.5% | 10.6%(+20.9)#59 | 11.4%(+20.1)#1,296 |
| 10. | 78701 | 31.4% | 10.6%(+20.8)#60 | 11.4%(+20.0)#1,308 |
| 11. | 78717 | 30.6% | 10.6%(+20.0)#63 | 11.4%(+19.2)#1,383 |
| 12. | 78735 | 26.7% | 10.6%(+16.1)#83 | 11.4%(+15.3)#1,915 |
| 13. | 78731 | 26.5% | 10.6%(+15.9)#88 | 11.4%(+15.1)#1,944 |
| 14. | 78750 | 25.6% | 10.6%(+15.0)#94 | 11.4%(+14.2)#2,080 |
| 15. | 78726 | 24.4% | 10.6%(+13.8)#102 | 11.4%(+13.0)#2,296 |
| 16. | 78749 | 22.9% | 10.6%(+12.3)#115 | 11.4%(+11.5)#2,571 |
| 17. | 78759 | 21.9% | 10.6%(+11.3)#134 | 11.4%(+10.5)#2,793 |
| 18. | 78756 | 21.3% | 10.6%(+10.7)#147 | 11.4%(+9.90)#2,942 |
| 19. | 78736 | 19.8% | 10.6%(+9.20)#171 | 11.4%(+8.40)#3,348 |
| 20. | 78704 | 19.7% | 10.6%(+9.10)#173 | 11.4%(+8.30)#3,361 |
| 21. | 78757 | 18.6% | 10.6%(+8.00)#188 | 11.4%(+7.20)#3,673 |
| 22. | 78702 | 16.9% | 10.6%(+6.30)#211 | 11.4%(+5.50)#4,223 |
| 23. | 78722 | 16.6% | 10.6%(+6.00)#218 | 11.4%(+5.20)#4,342 |
| 24. | 78727 | 14.6% | 10.6%(+4.00)#263 | 11.4%(+3.20)#5,177 |
| 25. | 78723 | 14.5% | 10.6%(+3.90)#267 | 11.4%(+3.10)#5,211 |
| 26. | 78748 | 13.4% | 10.6%(+2.80)#303 | 11.4%(+2.00)#5,778 |
| 27. | 78721 | 13.4% | 10.6%(+2.80)#306 | 11.4%(+2.00)#5,807 |
| 28. | 78729 | 13.1% | 10.6%(+2.50)#317 | 11.4%(+1.70)#5,953 |
| 29. | 78751 | 12.0% | 10.6%(+1.40)#358 | 11.4%(+0.600)#6,675 |
| 30. | 78745 | 10.1% | 10.6%(-0.500)#461 | 11.4%(-1.30)#8,129 |
| 31. | 78725 | 9.8% | 10.6%(-0.800)#478 | 11.4%(-1.60)#8,469 |
| 32. | 78747 | 7.8% | 10.6%(-2.80)#631 | 11.4%(-3.60)#10,625 |
| 33. | 78754 | 7.7% | 10.6%(-2.90)#642 | 11.4%(-3.70)#10,761 |
| 34. | 78724 | 6.9% | 10.6%(-3.70)#713 | 11.4%(-4.50)#11,913 |
| 35. | 78728 | 6.7% | 10.6%(-3.90)#735 | 11.4%(-4.70)#12,226 |
| 36. | 78758 | 6.6% | 10.6%(-4.00)#747 | 11.4%(-4.80)#12,390 |
| 37. | 78752 | 6.1% | 10.6%(-4.50)#805 | 11.4%(-5.30)#13,273 |
| 38. | 78719 | 5.9% | 10.6%(-4.70)#844 | 11.4%(-5.50)#13,763 |
| 39. | 78741 | 5.7% | 10.6%(-4.90)#868 | 11.4%(-5.70)#14,052 |
| 40. | 78744 | 5.3% | 10.6%(-5.30)#925 | 11.4%(-6.10)#14,868 |
| 41. | 78705 | 5.0% | 10.6%(-5.60)#958 | 11.4%(-6.40)#15,576 |
| 42. | 78753 | 4.3% | 10.6%(-6.30)#1,049 | 11.4%(-7.10)#17,243 |
| 43. | 78742 | 3.7% | 10.6%(-6.90)#1,158 | 11.4%(-7.70)#19,063 |
1
Common Questions
What are the Top 10 Zip Codes with the Highest Percentage of Households with Income Above $200,000 in Austin, TX?
Top 10 Zip Codes with the Highest Percentage of Households with Income Above $200,000 in Austin, TX are:
What zip code has the Highest Percentage of Households with Income Above $200,000 in Austin, TX?
78739 has the Highest Percentage of Households with Income Above $200,000 in Austin, TX with 51.7%.
What is the Percentage of Households with Income Above $200,000 in Austin, TX?
Percentage of Households with Income Above $200,000 in Austin is 15.8%.
What is the Percentage of Households with Income Above $200,000 in Texas?
Percentage of Households with Income Above $200,000 in Texas is 10.6%.
What is the Percentage of Households with Income Above $200,000 in the United States?
Percentage of Households with Income Above $200,000 in the United States is 11.4%.