Zip Codes with the Highest Percentage of Population Employed in Security & Protection in Austin, TX

RELATED REPORTS & OPTIONS

Security & Protection
Population
Families and Households
Female Fertility
Female Fertility (Unmarried)
Race (Community Size)
Race (Percentage)
Ancestry (Community Size)
AfghanAfricanAlbanianAlsatianAmericanApacheArabArgentineanArmenianAssyrian / Chaldean / SyriacAustralianAustrianBahamianBangladeshiBarbadianBasqueBelgianBelizeanBhutaneseBlackfeetBolivianBrazilianBritishBritish West IndianBulgarianBurmeseCajunCambodianCanadianCape VerdeanCelticCentral AmericanCentral American IndianCherokeeCheyenneChickasawChileanChippewaChoctawColombianComancheCosta RicanCreeCreekCroatianCrowCubanCzechCzechoslovakianDanishDelawareDominicanDutchDutch West IndianEastern EuropeanEcuadorianEgyptianEnglishEstonianEthiopianEuropeanFilipinoFinnishFrenchFrench American IndianFrench CanadianGermanGerman RussianGhanaianGreekGuamanian / ChamorroGuatemalanGuyaneseHaitianHonduranHopiHungarianIcelanderIndian (Asian)IndonesianIranianIraqiIrishIroquoisIsraeliItalianJamaicanJapaneseJordanianKenyanKiowaKoreanLaotianLatvianLebaneseLiberianLithuanianLumbeeLuxembourgerMacedonianMalaysianMalteseMexicanMexican American IndianMongolianMoroccanNative HawaiianNavajoNew ZealanderNicaraguanNigerianNorthern EuropeanNorwegianOkinawanOsagePakistaniPalestinianPanamanianParaguayanPennsylvania GermanPeruvianPolishPortuguesePotawatomiPuebloPuerto RicanRomanianRussianSalvadoranSamoanScandinavianScotch-IrishScottishSeminoleSerbianSiouxSlavicSlovakSloveneSomaliSouth AfricanSouth AmericanSouth American IndianSpaniardSpanishSpanish AmericanSpanish American IndianSri LankanSubsaharan AfricanSudaneseSwedishSwissSyrianThaiTlingit-HaidaTonganTrinidadian and TobagonianTurkishUkrainianUruguayanVenezuelanVietnameseWelshWest IndianYaquiYugoslavian
Ancestry (Percentage)
AfghanAfricanAlbanianAlsatianAmericanApacheArabArgentineanArmenianAssyrian / Chaldean / SyriacAustralianAustrianBahamianBangladeshiBarbadianBasqueBelgianBelizeanBhutaneseBlackfeetBolivianBrazilianBritishBritish West IndianBulgarianBurmeseCajunCambodianCanadianCape VerdeanCelticCentral AmericanCentral American IndianCherokeeCheyenneChickasawChileanChippewaChoctawColombianComancheCosta RicanCreeCreekCroatianCrowCubanCzechCzechoslovakianDanishDelawareDominicanDutchDutch West IndianEastern EuropeanEcuadorianEgyptianEnglishEstonianEthiopianEuropeanFilipinoFinnishFrenchFrench American IndianFrench CanadianGermanGerman RussianGhanaianGreekGuamanian / ChamorroGuatemalanGuyaneseHaitianHonduranHopiHungarianIcelanderIndian (Asian)IndonesianIranianIraqiIrishIroquoisIsraeliItalianJamaicanJapaneseJordanianKenyanKiowaKoreanLaotianLatvianLebaneseLiberianLithuanianLumbeeLuxembourgerMacedonianMalaysianMalteseMexicanMexican American IndianMongolianMoroccanNative HawaiianNavajoNew ZealanderNicaraguanNigerianNorthern EuropeanNorwegianOkinawanOsagePakistaniPalestinianPanamanianParaguayanPennsylvania GermanPeruvianPolishPortuguesePotawatomiPuebloPuerto RicanRomanianRussianSalvadoranSamoanScandinavianScotch-IrishScottishSeminoleSerbianSiouxSlavicSlovakSloveneSomaliSouth AfricanSouth AmericanSouth American IndianSpaniardSpanishSpanish AmericanSpanish American IndianSri LankanSubsaharan AfricanSudaneseSwedishSwissSyrianThaiTlingit-HaidaTonganTrinidadian and TobagonianTurkishUkrainianUruguayanVenezuelanVietnameseWelshWest IndianYaquiYugoslavian
Immigrant Origin (Total)
AfghanistanAfricaAlbaniaArgentinaAsiaAustraliaAustriaBahamasBangladeshBarbadosBelarusBelgiumBelizeBoliviaBosnia and HerzegovinaBrazilBulgariaBurma / MyanmarCambodiaCameroonCanadaCaribbeanCentral AmericaChileChinaColombiaCongoCosta RicaCroatiaCubaCzechoslovakiaDenmarkDominicaDominican RepublicEastern AfricaEastern AsiaEastern EuropeEcuadorEgyptEl SalvadorEnglandEritreaEthiopiaEuropeFranceGermanyGhanaGreeceGuatemalaGuyanaHaitiHondurasHong KongHungaryIndiaIndonesiaIranIraqIrelandIsraelItalyJamaicaJapanJordanKazakhstanKenyaKoreaKuwaitLaosLatin AmericaLatviaLebanonLiberiaLithuaniaMalaysiaMexicoMiddle AfricaMoldovaMoroccoNepalNetherlandsNicaraguaNigeriaNorthern AfricaNorthern EuropeNorwayOceaniaPakistanPanamaPeruPhilippinesPolandPortugalRomaniaRussiaSaudi ArabiaScotlandSerbiaSierra LeoneSingaporeSouth AfricaSouth AmericaSouth Central AsiaSouth Eastern AsiaSouthern EuropeSpainSri LankaSudanSwedenSwitzerlandSyriaTaiwanThailandTrinidad and TobagoTurkeyUgandaUkraineUruguayUzbekistanVenezuelaVietnamWestern AfricaWestern AsiaWestern EuropeYemenZaireZimbabwe
Immigrant Origin (Percentage)
AfghanistanAfricaAlbaniaArgentinaAsiaAustraliaAustriaBahamasBangladeshBarbadosBelarusBelgiumBelizeBoliviaBosnia and HerzegovinaBrazilBulgariaBurma / MyanmarCambodiaCameroonCanadaCaribbeanCentral AmericaChileChinaColombiaCongoCosta RicaCroatiaCubaCzechoslovakiaDenmarkDominicaDominican RepublicEastern AfricaEastern AsiaEastern EuropeEcuadorEgyptEl SalvadorEnglandEritreaEthiopiaEuropeFranceGermanyGhanaGreeceGuatemalaGuyanaHaitiHondurasHong KongHungaryIndiaIndonesiaIranIraqIrelandIsraelItalyJamaicaJapanJordanKazakhstanKenyaKoreaKuwaitLaosLatin AmericaLatviaLebanonLiberiaLithuaniaMalaysiaMexicoMiddle AfricaMoldovaMoroccoNepalNetherlandsNicaraguaNigeriaNorthern AfricaNorthern EuropeNorwayOceaniaPakistanPanamaPeruPhilippinesPolandPortugalRomaniaRussiaSaudi ArabiaScotlandSerbiaSierra LeoneSingaporeSouth AfricaSouth AmericaSouth Central AsiaSouth Eastern AsiaSouthern EuropeSpainSri LankaSudanSwedenSwitzerlandSyriaTaiwanThailandTrinidad and TobagoTurkeyUgandaUkraineUruguayUzbekistanVenezuelaVietnamWestern AfricaWestern AsiaWestern EuropeYemenZaireZimbabwe
Income
Income (Families)
Income (Households)
Poverty
Poverty (Families)
Unemployment
Employment Occupations
Employment Industries
Employer Class
Commute Time
Commute Means
School Enrollment
Education by Degree Field
Occupancy
Finances
Physical Characteristics
Austin
Compare Zip Codes
Comparison Subject

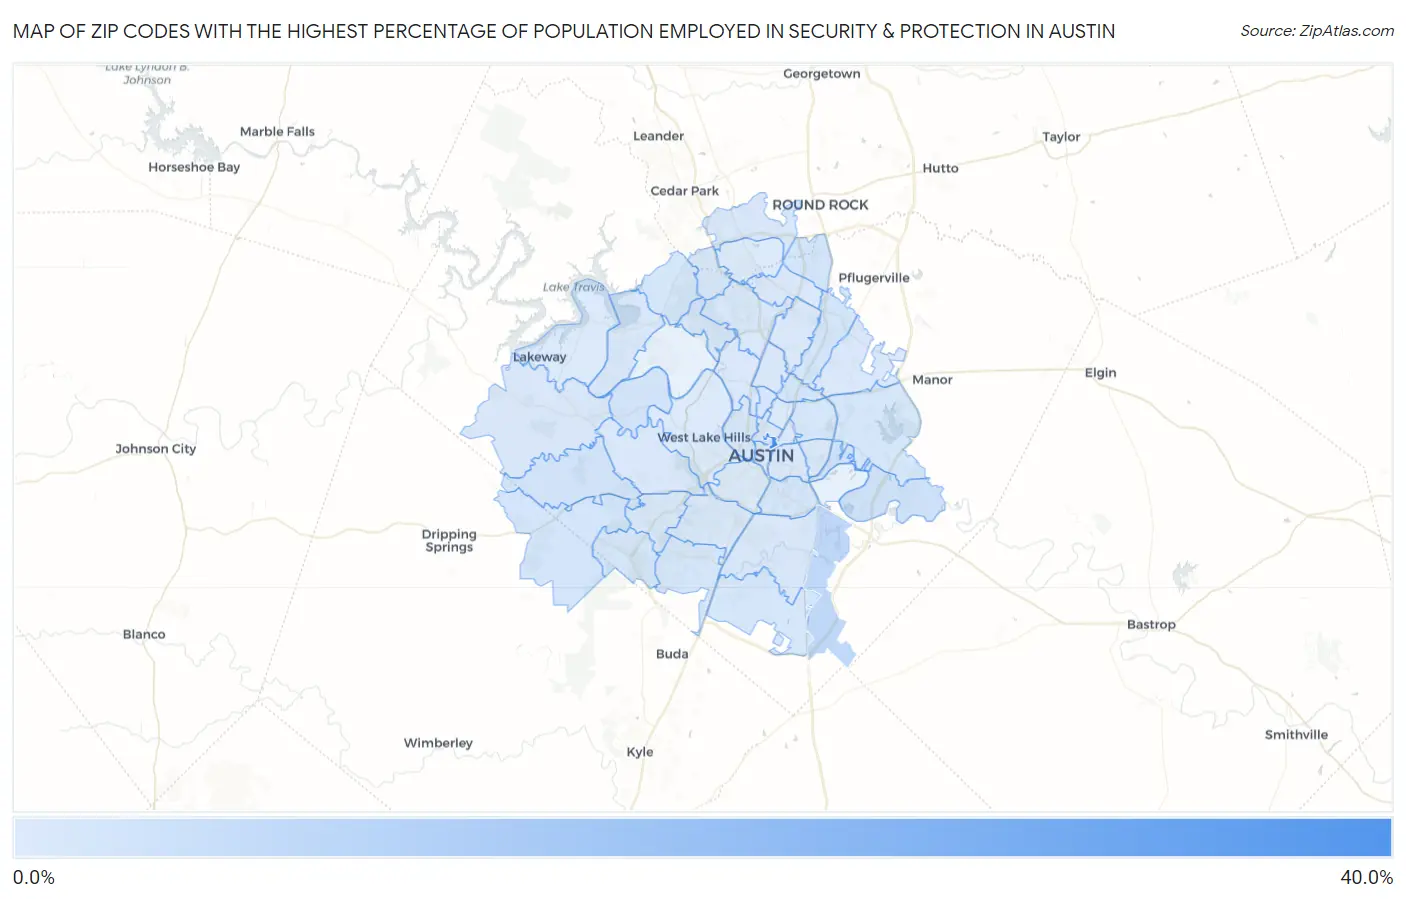
Map of Zip Codes with the Highest Percentage of Population Employed in Security & Protection in Austin

0.0%
40.0%
Zip Codes with the Highest Percentage of Population Employed in Security & Protection in Austin Map

Zip Codes with the Highest Percentage of Population Employed in Security & Protection in Austin, TX

Zip Code % Employed vs State vs National
1.7871233.3%2.2%(+31.1)#72.1%(+31.2)#79
2.787196.3%2.2%(+4.04)#1532.1%(+4.12)#1,914
3.787252.9%2.2%(+0.680)#5492.1%(+0.756)#7,623
4.787362.7%2.2%(+0.440)#6142.1%(+0.515)#8,699
5.787332.4%2.2%(+0.159)#7142.1%(+0.234)#10,142
6.787282.0%2.2%(-0.207)#8522.1%(-0.132)#12,448
7.787371.9%2.2%(-0.333)#9112.1%(-0.258)#13,292
8.787531.9%2.2%(-0.334)#9132.1%(-0.258)#13,302
9.787521.8%2.2%(-0.432)#9532.1%(-0.356)#14,006
10.787231.8%2.2%(-0.450)#9622.1%(-0.375)#14,136
11.787391.7%2.2%(-0.501)#9852.1%(-0.425)#14,503
12.787261.7%2.2%(-0.525)#9952.1%(-0.449)#14,691
13.787561.6%2.2%(-0.627)#1,0352.1%(-0.552)#15,443
14.787411.6%2.2%(-0.642)#1,0502.1%(-0.566)#15,553
15.787471.5%2.2%(-0.709)#1,0792.1%(-0.633)#16,074
16.787241.5%2.2%(-0.755)#1,0912.1%(-0.679)#16,429
17.787481.4%2.2%(-0.803)#1,1132.1%(-0.727)#16,796
18.787321.2%2.2%(-1.05)#1,2142.1%(-0.973)#18,702
19.787491.1%2.2%(-1.08)#1,2282.1%(-1.01)#18,972
20.787501.1%2.2%(-1.09)#1,2302.1%(-1.02)#19,058
21.787051.1%2.2%(-1.15)#1,2572.1%(-1.07)#19,457
22.787451.1%2.2%(-1.17)#1,2682.1%(-1.09)#19,609
23.787171.1%2.2%(-1.17)#1,2702.1%(-1.09)#19,626
24.787031.0%2.2%(-1.21)#1,2902.1%(-1.13)#19,916
25.787441.00%2.2%(-1.23)#1,3022.1%(-1.15)#20,047
26.787381.00%2.2%(-1.23)#1,3032.1%(-1.15)#20,056
27.787210.99%2.2%(-1.23)#1,3082.1%(-1.16)#20,092
28.787590.96%2.2%(-1.26)#1,3232.1%(-1.19)#20,370
29.787510.86%2.2%(-1.36)#1,3572.1%(-1.29)#21,017
30.787350.84%2.2%(-1.38)#1,3672.1%(-1.31)#21,162
31.787540.80%2.2%(-1.42)#1,3772.1%(-1.35)#21,403
32.787220.61%2.2%(-1.61)#1,4322.1%(-1.54)#22,609
33.787020.56%2.2%(-1.66)#1,4522.1%(-1.59)#22,901
34.787270.55%2.2%(-1.67)#1,4562.1%(-1.60)#22,957
35.787580.50%2.2%(-1.72)#1,4662.1%(-1.65)#23,217
36.787310.46%2.2%(-1.76)#1,4762.1%(-1.68)#23,424
37.787570.46%2.2%(-1.76)#1,4772.1%(-1.68)#23,425
38.787340.44%2.2%(-1.79)#1,4802.1%(-1.71)#23,551
39.787460.36%2.2%(-1.86)#1,4912.1%(-1.79)#23,910
40.787290.31%2.2%(-1.91)#1,4972.1%(-1.84)#24,132
41.787040.31%2.2%(-1.92)#1,4982.1%(-1.84)#24,147
42.787010.23%2.2%(-2.00)#1,5162.1%(-1.92)#24,442

Common Questions

What are the Top 10 Zip Codes with the Highest Percentage of Population Employed in Security & Protection in Austin, TX?
Top 10 Zip Codes with the Highest Percentage of Population Employed in Security & Protection in Austin, TX are:
#1
33.3%
#2
6.3%
#3
2.9%
#4
2.7%
#5
2.4%
#6
2.0%
#7
1.9%
#8
1.9%
#9
1.8%
#10
1.8%
What zip code has the Highest Percentage of Population Employed in Security & Protection in Austin, TX?
78712 has the Highest Percentage of Population Employed in Security & Protection in Austin, TX with 33.3%.
What is the Percentage of Population Employed in Security & Protection in Austin, TX?
Percentage of Population Employed in Security & Protection in Austin is 1.0%.
What is the Percentage of Population Employed in Security & Protection in Texas?
Percentage of Population Employed in Security & Protection in Texas is 2.2%.
What is the Percentage of Population Employed in Security & Protection in the United States?
Percentage of Population Employed in Security & Protection in the United States is 2.1%.