Zip Codes with the Highest Percentage of Households with Income Above $200,000 in Beaumont, TX
RELATED REPORTS & OPTIONS
Household Income | $200k+
Beaumont
Compare Zip Codes
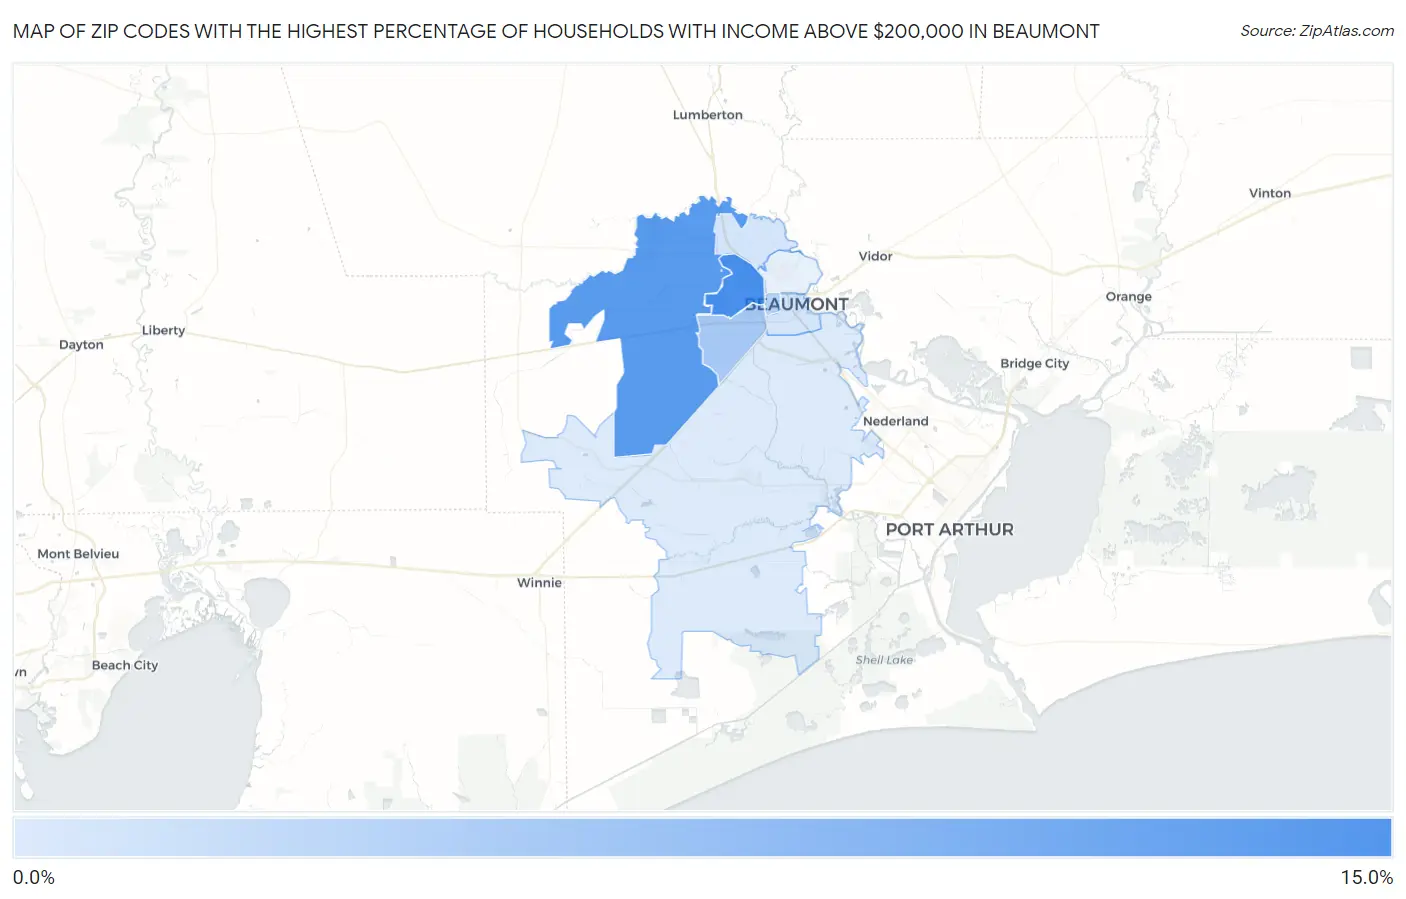
Map of Zip Codes with the Highest Percentage of Households with Income Above $200,000 in Beaumont
2.1%
12.9%
Zip Codes with the Highest Percentage of Households with Income Above $200,000 in Beaumont, TX
| Zip Code | Households with Income > $200k | vs State | vs National | |
| 1. | 77706 | 12.9% | 10.6%(+2.30)#322 | 11.4%(+1.50)#6,073 |
| 2. | 77713 | 11.7% | 10.6%(+1.10)#372 | 11.4%(+0.300)#6,870 |
| 3. | 77707 | 6.0% | 10.6%(-4.60)#819 | 11.4%(-5.40)#13,466 |
| 4. | 77702 | 4.7% | 10.6%(-5.90)#1,014 | 11.4%(-6.70)#16,397 |
| 5. | 77708 | 2.7% | 10.6%(-7.90)#1,308 | 11.4%(-8.70)#21,762 |
| 6. | 77701 | 2.7% | 10.6%(-7.90)#1,309 | 11.4%(-8.70)#21,764 |
| 7. | 77705 | 2.1% | 10.6%(-8.50)#1,405 | 11.4%(-9.30)#23,449 |
1
Common Questions
What are the Top 5 Zip Codes with the Highest Percentage of Households with Income Above $200,000 in Beaumont, TX?
Top 5 Zip Codes with the Highest Percentage of Households with Income Above $200,000 in Beaumont, TX are:
What zip code has the Highest Percentage of Households with Income Above $200,000 in Beaumont, TX?
77706 has the Highest Percentage of Households with Income Above $200,000 in Beaumont, TX with 12.9%.
What is the Percentage of Households with Income Above $200,000 in Beaumont, TX?
Percentage of Households with Income Above $200,000 in Beaumont is 5.9%.
What is the Percentage of Households with Income Above $200,000 in Texas?
Percentage of Households with Income Above $200,000 in Texas is 10.6%.
What is the Percentage of Households with Income Above $200,000 in the United States?
Percentage of Households with Income Above $200,000 in the United States is 11.4%.