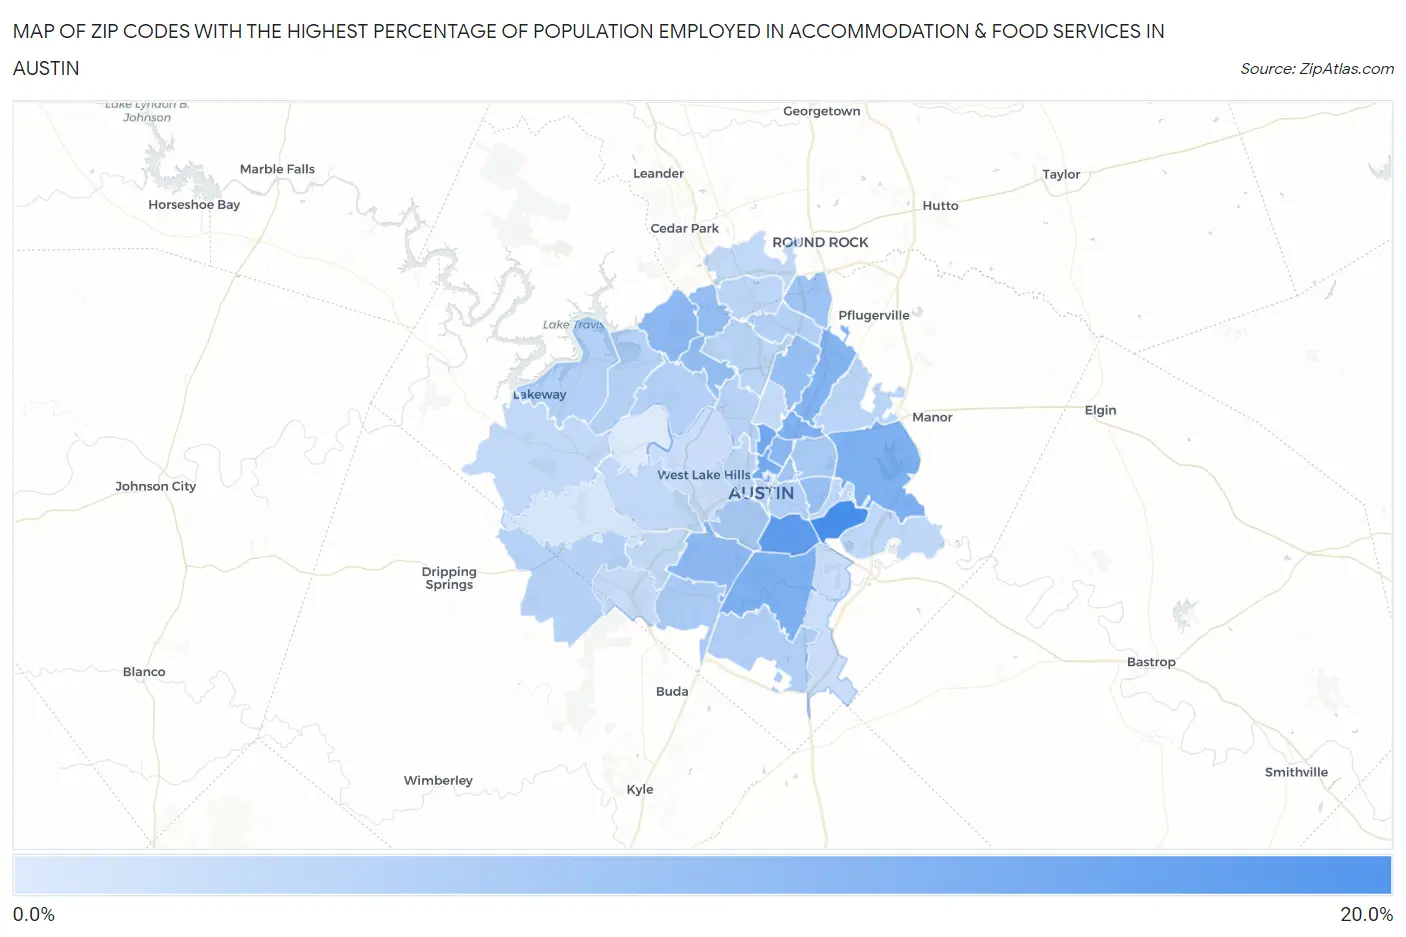
Zip Codes with the Highest Percentage of Population Employed in Accommodation & Food Services in Austin, TX
RELATED REPORTS & OPTIONS
Accommodation & Food Services
Austin
Compare Zip Codes
Map of Zip Codes with the Highest Percentage of Population Employed in Accommodation & Food Services in Austin
0.48%
17.3%
Zip Codes with the Highest Percentage of Population Employed in Accommodation & Food Services in Austin, TX
| Zip Code | % Employed | vs State | vs National | |
| 1. | 78742 | 17.3% | 7.2%(+10.1)#62 | 6.9%(+10.5)#1,204 |
| 2. | 78741 | 14.5% | 7.2%(+7.26)#94 | 6.9%(+7.59)#1,825 |
| 3. | 78756 | 12.7% | 7.2%(+5.52)#140 | 6.9%(+5.84)#2,474 |
| 4. | 78705 | 11.9% | 7.2%(+4.72)#171 | 6.9%(+5.05)#2,878 |
| 5. | 78744 | 11.0% | 7.2%(+3.82)#212 | 6.9%(+4.15)#3,531 |
| 6. | 78752 | 10.8% | 7.2%(+3.63)#224 | 6.9%(+3.95)#3,693 |
| 7. | 78724 | 10.7% | 7.2%(+3.48)#231 | 6.9%(+3.80)#3,809 |
| 8. | 78753 | 10.3% | 7.2%(+3.11)#255 | 6.9%(+3.44)#4,183 |
| 9. | 78751 | 9.8% | 7.2%(+2.59)#303 | 6.9%(+2.92)#4,801 |
| 10. | 78726 | 9.3% | 7.2%(+2.07)#368 | 6.9%(+2.40)#5,540 |
| 11. | 78745 | 9.2% | 7.2%(+2.00)#374 | 6.9%(+2.33)#5,639 |
| 12. | 78750 | 8.1% | 7.2%(+0.937)#533 | 6.9%(+1.26)#7,554 |
| 13. | 78758 | 8.0% | 7.2%(+0.811)#554 | 6.9%(+1.14)#7,789 |
| 14. | 78721 | 7.9% | 7.2%(+0.662)#575 | 6.9%(+0.987)#8,099 |
| 15. | 78728 | 7.3% | 7.2%(+0.069)#677 | 6.9%(+0.394)#9,602 |
| 16. | 78722 | 7.0% | 7.2%(-0.195)#716 | 6.9%(+0.129)#10,268 |
| 17. | 78704 | 6.4% | 7.2%(-0.785)#838 | 6.9%(-0.460)#12,089 |
| 18. | 78723 | 6.1% | 7.2%(-1.10)#900 | 6.9%(-0.771)#13,101 |
| 19. | 78748 | 5.9% | 7.2%(-1.33)#935 | 6.9%(-1.00)#13,850 |
| 20. | 78747 | 5.4% | 7.2%(-1.81)#1,019 | 6.9%(-1.48)#15,424 |
| 21. | 78702 | 5.0% | 7.2%(-2.24)#1,097 | 6.9%(-1.91)#16,934 |
| 22. | 78730 | 4.9% | 7.2%(-2.28)#1,106 | 6.9%(-1.96)#17,079 |
| 23. | 78734 | 4.8% | 7.2%(-2.37)#1,126 | 6.9%(-2.05)#17,369 |
| 24. | 78727 | 4.8% | 7.2%(-2.38)#1,127 | 6.9%(-2.05)#17,391 |
| 25. | 78732 | 4.8% | 7.2%(-2.46)#1,144 | 6.9%(-2.13)#17,658 |
| 26. | 78737 | 4.5% | 7.2%(-2.68)#1,182 | 6.9%(-2.36)#18,427 |
| 27. | 78731 | 4.4% | 7.2%(-2.83)#1,213 | 6.9%(-2.51)#18,917 |
| 28. | 78759 | 4.1% | 7.2%(-3.06)#1,243 | 6.9%(-2.74)#19,681 |
| 29. | 78754 | 4.0% | 7.2%(-3.18)#1,261 | 6.9%(-2.86)#20,080 |
| 30. | 78729 | 3.9% | 7.2%(-3.29)#1,281 | 6.9%(-2.97)#20,434 |
| 31. | 78701 | 3.8% | 7.2%(-3.40)#1,298 | 6.9%(-3.07)#20,769 |
| 32. | 78725 | 3.7% | 7.2%(-3.52)#1,323 | 6.9%(-3.20)#21,185 |
| 33. | 78703 | 3.6% | 7.2%(-3.65)#1,344 | 6.9%(-3.32)#21,589 |
| 34. | 78738 | 3.5% | 7.2%(-3.74)#1,366 | 6.9%(-3.42)#21,905 |
| 35. | 78717 | 3.4% | 7.2%(-3.80)#1,377 | 6.9%(-3.47)#22,070 |
| 36. | 78735 | 3.3% | 7.2%(-3.88)#1,392 | 6.9%(-3.55)#22,310 |
| 37. | 78757 | 3.3% | 7.2%(-3.95)#1,401 | 6.9%(-3.63)#22,540 |
| 38. | 78749 | 3.2% | 7.2%(-4.03)#1,413 | 6.9%(-3.71)#22,777 |
| 39. | 78739 | 2.8% | 7.2%(-4.44)#1,462 | 6.9%(-4.11)#23,838 |
| 40. | 78719 | 2.5% | 7.2%(-4.68)#1,479 | 6.9%(-4.35)#24,411 |
| 41. | 78746 | 2.5% | 7.2%(-4.72)#1,486 | 6.9%(-4.39)#24,529 |
| 42. | 78736 | 1.2% | 7.2%(-6.04)#1,591 | 6.9%(-5.71)#27,024 |
| 43. | 78733 | 0.48% | 7.2%(-6.72)#1,623 | 6.9%(-6.40)#27,880 |
1
Common Questions
What are the Top 10 Zip Codes with the Highest Percentage of Population Employed in Accommodation & Food Services in Austin, TX?
Top 10 Zip Codes with the Highest Percentage of Population Employed in Accommodation & Food Services in Austin, TX are:
What zip code has the Highest Percentage of Population Employed in Accommodation & Food Services in Austin, TX?
78742 has the Highest Percentage of Population Employed in Accommodation & Food Services in Austin, TX with 17.3%.
What is the Percentage of Population Employed in Accommodation & Food Services in Austin, TX?
Percentage of Population Employed in Accommodation & Food Services in Austin is 7.3%.
What is the Percentage of Population Employed in Accommodation & Food Services in Texas?
Percentage of Population Employed in Accommodation & Food Services in Texas is 7.2%.
What is the Percentage of Population Employed in Accommodation & Food Services in the United States?
Percentage of Population Employed in Accommodation & Food Services in the United States is 6.9%.