Zip Codes with the Highest Percentage of Households Without a Vehicle in Austin, TX
RELATED REPORTS & OPTIONS
Households without a Cars
Austin
Compare Zip Codes
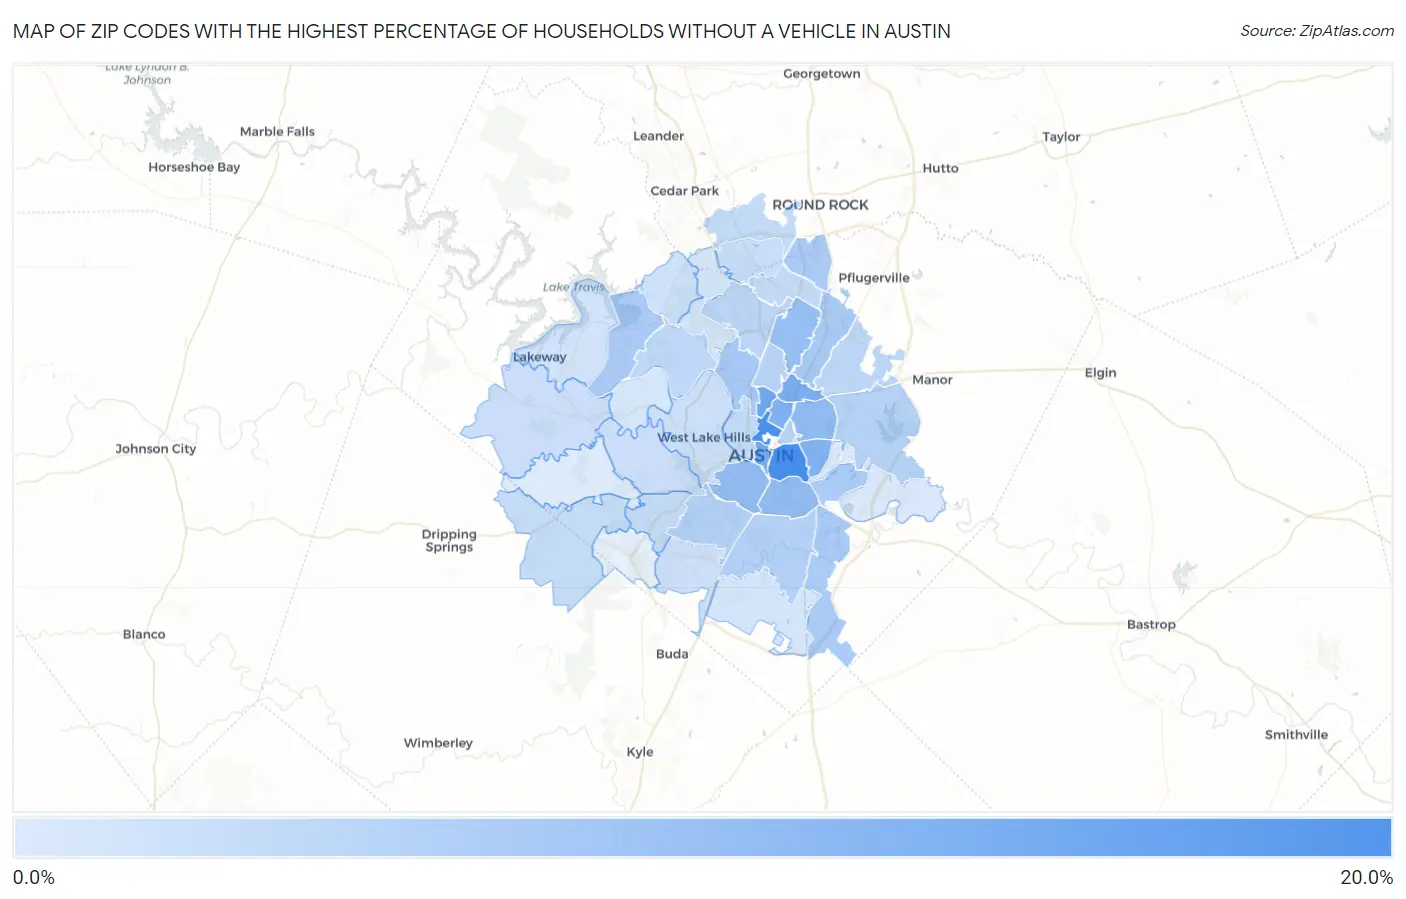
Map of Zip Codes with the Highest Percentage of Households Without a Vehicle in Austin
0.40%
18.6%
Zip Codes with the Highest Percentage of Households Without a Vehicle in Austin, TX
| Zip Code | Housholds Without a Car | vs State | vs National | |
| 1. | 78702 | 18.6% | 5.3%(+13.3)#42 | 8.3%(+10.3)#1,693 |
| 2. | 78705 | 18.0% | 5.3%(+12.7)#48 | 8.3%(+9.70)#1,775 |
| 3. | 78756 | 13.9% | 5.3%(+8.60)#101 | 8.3%(+5.60)#2,735 |
| 4. | 78701 | 12.8% | 5.3%(+7.50)#126 | 8.3%(+4.50)#3,190 |
| 5. | 78752 | 12.1% | 5.3%(+6.80)#152 | 8.3%(+3.80)#3,506 |
| 6. | 78751 | 11.4% | 5.3%(+6.10)#175 | 8.3%(+3.10)#3,896 |
| 7. | 78721 | 11.1% | 5.3%(+5.80)#186 | 8.3%(+2.80)#4,087 |
| 8. | 78723 | 9.3% | 5.3%(+4.00)#253 | 8.3%(+1.00)#5,420 |
| 9. | 78741 | 9.1% | 5.3%(+3.80)#269 | 8.3%(+0.800)#5,614 |
| 10. | 78704 | 8.9% | 5.3%(+3.60)#282 | 8.3%(+0.600)#5,827 |
| 11. | 78758 | 8.4% | 5.3%(+3.10)#308 | 8.3%(+0.100)#6,411 |
| 12. | 78731 | 6.7% | 5.3%(+1.40)#447 | 8.3%(-1.60)#9,027 |
| 13. | 78753 | 6.5% | 5.3%(+1.20)#467 | 8.3%(-1.80)#9,353 |
| 14. | 78719 | 6.3% | 5.3%(+1.00)#498 | 8.3%(-2.00)#9,926 |
| 15. | 78742 | 6.3% | 5.3%(+1.00)#499 | 8.3%(-2.00)#9,936 |
| 16. | 78732 | 6.2% | 5.3%(+0.900)#505 | 8.3%(-2.10)#10,032 |
| 17. | 78728 | 6.1% | 5.3%(+0.800)#515 | 8.3%(-2.20)#10,208 |
| 18. | 78745 | 5.1% | 5.3%(-0.200)#639 | 8.3%(-3.20)#12,568 |
| 19. | 78744 | 5.1% | 5.3%(-0.200)#640 | 8.3%(-3.20)#12,578 |
| 20. | 78724 | 4.9% | 5.3%(-0.400)#688 | 8.3%(-3.40)#13,114 |
| 21. | 78722 | 4.8% | 5.3%(-0.500)#711 | 8.3%(-3.50)#13,472 |
| 22. | 78757 | 4.6% | 5.3%(-0.700)#746 | 8.3%(-3.70)#13,932 |
| 23. | 78754 | 4.2% | 5.3%(-1.10)#822 | 8.3%(-4.10)#15,114 |
| 24. | 78759 | 4.0% | 5.3%(-1.30)#858 | 8.3%(-4.30)#15,688 |
| 25. | 78730 | 3.7% | 5.3%(-1.60)#917 | 8.3%(-4.60)#16,751 |
| 26. | 78717 | 3.4% | 5.3%(-1.90)#964 | 8.3%(-4.90)#17,628 |
| 27. | 78727 | 3.4% | 5.3%(-1.90)#965 | 8.3%(-4.90)#17,635 |
| 28. | 78749 | 2.9% | 5.3%(-2.40)#1,083 | 8.3%(-5.40)#19,397 |
| 29. | 78737 | 2.9% | 5.3%(-2.40)#1,084 | 8.3%(-5.40)#19,420 |
| 30. | 78703 | 2.9% | 5.3%(-2.40)#1,086 | 8.3%(-5.40)#19,430 |
| 31. | 78729 | 2.7% | 5.3%(-2.60)#1,130 | 8.3%(-5.60)#20,095 |
| 32. | 78738 | 2.6% | 5.3%(-2.70)#1,156 | 8.3%(-5.70)#20,421 |
| 33. | 78735 | 2.4% | 5.3%(-2.90)#1,195 | 8.3%(-5.90)#21,083 |
| 34. | 78748 | 2.1% | 5.3%(-3.20)#1,254 | 8.3%(-6.20)#22,034 |
| 35. | 78746 | 2.1% | 5.3%(-3.20)#1,257 | 8.3%(-6.20)#22,066 |
| 36. | 78726 | 1.9% | 5.3%(-3.40)#1,304 | 8.3%(-6.40)#22,811 |
| 37. | 78734 | 1.8% | 5.3%(-3.50)#1,326 | 8.3%(-6.50)#23,140 |
| 38. | 78747 | 1.4% | 5.3%(-3.90)#1,401 | 8.3%(-6.90)#24,440 |
| 39. | 78750 | 1.2% | 5.3%(-4.10)#1,434 | 8.3%(-7.10)#25,058 |
| 40. | 78733 | 1.2% | 5.3%(-4.10)#1,439 | 8.3%(-7.10)#25,098 |
| 41. | 78725 | 0.70% | 5.3%(-4.60)#1,528 | 8.3%(-7.60)#26,380 |
| 42. | 78736 | 0.40% | 5.3%(-4.90)#1,569 | 8.3%(-7.90)#27,004 |
1
Common Questions
What are the Top 10 Zip Codes with the Highest Percentage of Households Without a Vehicle in Austin, TX?
Top 10 Zip Codes with the Highest Percentage of Households Without a Vehicle in Austin, TX are:
What zip code has the Highest Percentage of Households Without a Vehicle in Austin, TX?
78702 has the Highest Percentage of Households Without a Vehicle in Austin, TX with 18.6%.
What is the Percentage of Households Without a Vehicle in Austin, TX?
Percentage of Households Without a Vehicle in Austin is 6.3%.
What is the Percentage of Households Without a Vehicle in Texas?
Percentage of Households Without a Vehicle in Texas is 5.3%.
What is the Percentage of Households Without a Vehicle in the United States?
Percentage of Households Without a Vehicle in the United States is 8.3%.