Zip Codes with the Highest Percentage of Population Employed in Administrative & Support Services in Austin, TX
RELATED REPORTS & OPTIONS
Administrative & Support Services
Austin
Compare Zip Codes
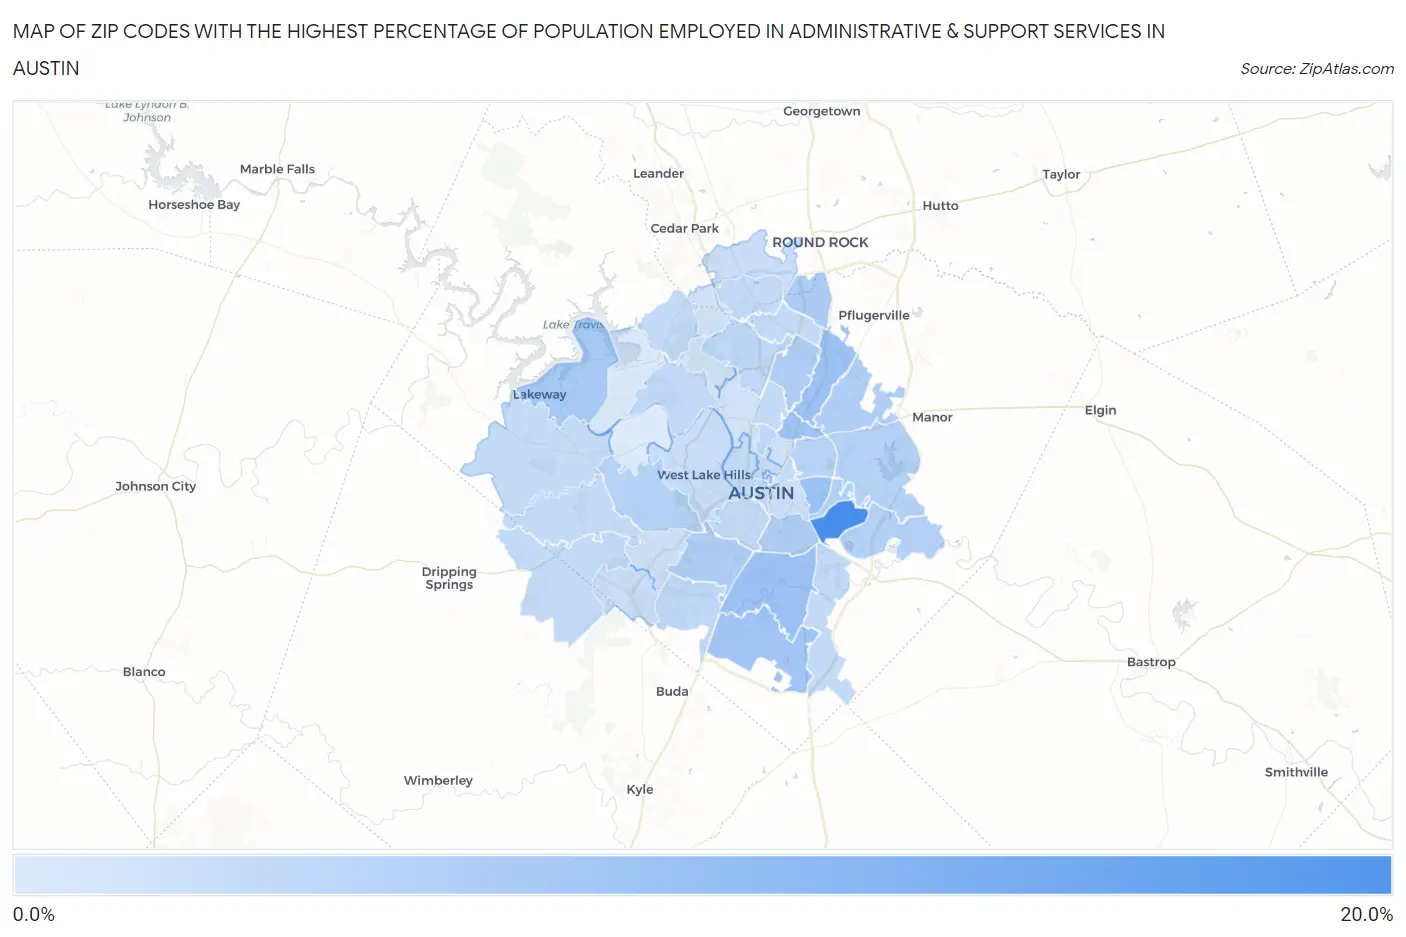
Map of Zip Codes with the Highest Percentage of Population Employed in Administrative & Support Services in Austin
0.91%
16.2%
Zip Codes with the Highest Percentage of Population Employed in Administrative & Support Services in Austin, TX
| Zip Code | % Employed | vs State | vs National | |
| 1. | 78742 | 16.2% | 4.4%(+11.8)#30 | 4.1%(+12.1)#451 |
| 2. | 78753 | 7.5% | 4.4%(+3.06)#191 | 4.1%(+3.32)#2,716 |
| 3. | 78744 | 7.4% | 4.4%(+3.02)#193 | 4.1%(+3.29)#2,749 |
| 4. | 78721 | 7.3% | 4.4%(+2.84)#207 | 4.1%(+3.10)#2,935 |
| 5. | 78752 | 7.1% | 4.4%(+2.66)#224 | 4.1%(+2.93)#3,134 |
| 6. | 78747 | 6.8% | 4.4%(+2.39)#252 | 4.1%(+2.66)#3,470 |
| 7. | 78734 | 6.2% | 4.4%(+1.74)#337 | 4.1%(+2.01)#4,495 |
| 8. | 78728 | 5.6% | 4.4%(+1.15)#413 | 4.1%(+1.41)#5,668 |
| 9. | 78758 | 5.4% | 4.4%(+0.968)#446 | 4.1%(+1.23)#6,119 |
| 10. | 78745 | 5.3% | 4.4%(+0.881)#459 | 4.1%(+1.15)#6,334 |
| 11. | 78754 | 5.1% | 4.4%(+0.727)#494 | 4.1%(+0.993)#6,728 |
| 12. | 78741 | 5.1% | 4.4%(+0.652)#506 | 4.1%(+0.919)#6,927 |
| 13. | 78725 | 5.0% | 4.4%(+0.551)#529 | 4.1%(+0.818)#7,195 |
| 14. | 78724 | 4.8% | 4.4%(+0.370)#571 | 4.1%(+0.636)#7,769 |
| 15. | 78735 | 4.6% | 4.4%(+0.232)#601 | 4.1%(+0.498)#8,200 |
| 16. | 78723 | 4.5% | 4.4%(+0.035)#635 | 4.1%(+0.301)#8,876 |
| 17. | 78756 | 4.1% | 4.4%(-0.315)#720 | 4.1%(-0.049)#10,237 |
| 18. | 78759 | 3.8% | 4.4%(-0.660)#806 | 4.1%(-0.394)#11,728 |
| 19. | 78748 | 3.7% | 4.4%(-0.667)#807 | 4.1%(-0.400)#11,767 |
| 20. | 78730 | 3.5% | 4.4%(-0.877)#871 | 4.1%(-0.610)#12,767 |
| 21. | 78737 | 3.4% | 4.4%(-0.971)#892 | 4.1%(-0.705)#13,243 |
| 22. | 78719 | 3.4% | 4.4%(-1.04)#910 | 4.1%(-0.776)#13,575 |
| 23. | 78736 | 3.3% | 4.4%(-1.07)#915 | 4.1%(-0.800)#13,687 |
| 24. | 78722 | 3.3% | 4.4%(-1.07)#916 | 4.1%(-0.803)#13,706 |
| 25. | 78701 | 3.3% | 4.4%(-1.10)#929 | 4.1%(-0.832)#13,857 |
| 26. | 78726 | 3.3% | 4.4%(-1.12)#934 | 4.1%(-0.851)#13,940 |
| 27. | 78729 | 3.3% | 4.4%(-1.12)#935 | 4.1%(-0.856)#13,970 |
| 28. | 78704 | 3.3% | 4.4%(-1.14)#944 | 4.1%(-0.874)#14,076 |
| 29. | 78757 | 3.3% | 4.4%(-1.16)#950 | 4.1%(-0.889)#14,153 |
| 30. | 78727 | 3.2% | 4.4%(-1.17)#954 | 4.1%(-0.905)#14,229 |
| 31. | 78703 | 3.2% | 4.4%(-1.21)#969 | 4.1%(-0.945)#14,453 |
| 32. | 78738 | 3.0% | 4.4%(-1.37)#1,019 | 4.1%(-1.10)#15,262 |
| 33. | 78746 | 2.8% | 4.4%(-1.57)#1,071 | 4.1%(-1.30)#16,265 |
| 34. | 78705 | 2.8% | 4.4%(-1.61)#1,086 | 4.1%(-1.35)#16,544 |
| 35. | 78717 | 2.7% | 4.4%(-1.76)#1,122 | 4.1%(-1.50)#17,339 |
| 36. | 78739 | 2.6% | 4.4%(-1.78)#1,124 | 4.1%(-1.51)#17,399 |
| 37. | 78702 | 2.4% | 4.4%(-2.05)#1,193 | 4.1%(-1.79)#18,864 |
| 38. | 78749 | 2.2% | 4.4%(-2.20)#1,226 | 4.1%(-1.93)#19,582 |
| 39. | 78751 | 2.2% | 4.4%(-2.22)#1,231 | 4.1%(-1.96)#19,692 |
| 40. | 78731 | 1.9% | 4.4%(-2.49)#1,303 | 4.1%(-2.22)#20,942 |
| 41. | 78750 | 1.8% | 4.4%(-2.59)#1,316 | 4.1%(-2.32)#21,392 |
| 42. | 78732 | 1.2% | 4.4%(-3.21)#1,432 | 4.1%(-2.94)#23,833 |
| 43. | 78733 | 0.91% | 4.4%(-3.50)#1,464 | 4.1%(-3.24)#24,790 |
1
Common Questions
What are the Top 10 Zip Codes with the Highest Percentage of Population Employed in Administrative & Support Services in Austin, TX?
Top 10 Zip Codes with the Highest Percentage of Population Employed in Administrative & Support Services in Austin, TX are:
What zip code has the Highest Percentage of Population Employed in Administrative & Support Services in Austin, TX?
78742 has the Highest Percentage of Population Employed in Administrative & Support Services in Austin, TX with 16.2%.
What is the Percentage of Population Employed in Administrative & Support Services in Austin, TX?
Percentage of Population Employed in Administrative & Support Services in Austin is 4.3%.
What is the Percentage of Population Employed in Administrative & Support Services in Texas?
Percentage of Population Employed in Administrative & Support Services in Texas is 4.4%.
What is the Percentage of Population Employed in Administrative & Support Services in the United States?
Percentage of Population Employed in Administrative & Support Services in the United States is 4.1%.