Zip Codes with the Highest Percentage of Not-for-profit Organizations in Austin, TX

RELATED REPORTS & OPTIONS

Not-for-profit Organizations
Population
Families and Households
Female Fertility
Female Fertility (Unmarried)
Race (Community Size)
Race (Percentage)
Ancestry (Community Size)
AfghanAfricanAlbanianAlsatianAmericanApacheArabArgentineanArmenianAssyrian / Chaldean / SyriacAustralianAustrianBahamianBangladeshiBarbadianBasqueBelgianBelizeanBhutaneseBlackfeetBolivianBrazilianBritishBritish West IndianBulgarianBurmeseCajunCambodianCanadianCape VerdeanCelticCentral AmericanCentral American IndianCherokeeCheyenneChickasawChileanChippewaChoctawColombianComancheCosta RicanCreeCreekCroatianCrowCubanCzechCzechoslovakianDanishDelawareDominicanDutchDutch West IndianEastern EuropeanEcuadorianEgyptianEnglishEstonianEthiopianEuropeanFilipinoFinnishFrenchFrench American IndianFrench CanadianGermanGerman RussianGhanaianGreekGuamanian / ChamorroGuatemalanGuyaneseHaitianHonduranHopiHungarianIcelanderIndian (Asian)IndonesianIranianIraqiIrishIroquoisIsraeliItalianJamaicanJapaneseJordanianKenyanKiowaKoreanLaotianLatvianLebaneseLiberianLithuanianLumbeeLuxembourgerMacedonianMalaysianMalteseMexicanMexican American IndianMongolianMoroccanNative HawaiianNavajoNew ZealanderNicaraguanNigerianNorthern EuropeanNorwegianOkinawanOsagePakistaniPalestinianPanamanianParaguayanPennsylvania GermanPeruvianPolishPortuguesePotawatomiPuebloPuerto RicanRomanianRussianSalvadoranSamoanScandinavianScotch-IrishScottishSeminoleSerbianSiouxSlavicSlovakSloveneSomaliSouth AfricanSouth AmericanSouth American IndianSpaniardSpanishSpanish AmericanSpanish American IndianSri LankanSubsaharan AfricanSudaneseSwedishSwissSyrianThaiTlingit-HaidaTonganTrinidadian and TobagonianTurkishUkrainianUruguayanVenezuelanVietnameseWelshWest IndianYaquiYugoslavian
Ancestry (Percentage)
AfghanAfricanAlbanianAlsatianAmericanApacheArabArgentineanArmenianAssyrian / Chaldean / SyriacAustralianAustrianBahamianBangladeshiBarbadianBasqueBelgianBelizeanBhutaneseBlackfeetBolivianBrazilianBritishBritish West IndianBulgarianBurmeseCajunCambodianCanadianCape VerdeanCelticCentral AmericanCentral American IndianCherokeeCheyenneChickasawChileanChippewaChoctawColombianComancheCosta RicanCreeCreekCroatianCrowCubanCzechCzechoslovakianDanishDelawareDominicanDutchDutch West IndianEastern EuropeanEcuadorianEgyptianEnglishEstonianEthiopianEuropeanFilipinoFinnishFrenchFrench American IndianFrench CanadianGermanGerman RussianGhanaianGreekGuamanian / ChamorroGuatemalanGuyaneseHaitianHonduranHopiHungarianIcelanderIndian (Asian)IndonesianIranianIraqiIrishIroquoisIsraeliItalianJamaicanJapaneseJordanianKenyanKiowaKoreanLaotianLatvianLebaneseLiberianLithuanianLumbeeLuxembourgerMacedonianMalaysianMalteseMexicanMexican American IndianMongolianMoroccanNative HawaiianNavajoNew ZealanderNicaraguanNigerianNorthern EuropeanNorwegianOkinawanOsagePakistaniPalestinianPanamanianParaguayanPennsylvania GermanPeruvianPolishPortuguesePotawatomiPuebloPuerto RicanRomanianRussianSalvadoranSamoanScandinavianScotch-IrishScottishSeminoleSerbianSiouxSlavicSlovakSloveneSomaliSouth AfricanSouth AmericanSouth American IndianSpaniardSpanishSpanish AmericanSpanish American IndianSri LankanSubsaharan AfricanSudaneseSwedishSwissSyrianThaiTlingit-HaidaTonganTrinidadian and TobagonianTurkishUkrainianUruguayanVenezuelanVietnameseWelshWest IndianYaquiYugoslavian
Immigrant Origin (Total)
AfghanistanAfricaAlbaniaArgentinaAsiaAustraliaAustriaBahamasBangladeshBarbadosBelarusBelgiumBelizeBoliviaBosnia and HerzegovinaBrazilBulgariaBurma / MyanmarCambodiaCameroonCanadaCaribbeanCentral AmericaChileChinaColombiaCongoCosta RicaCroatiaCubaCzechoslovakiaDenmarkDominicaDominican RepublicEastern AfricaEastern AsiaEastern EuropeEcuadorEgyptEl SalvadorEnglandEritreaEthiopiaEuropeFranceGermanyGhanaGreeceGuatemalaGuyanaHaitiHondurasHong KongHungaryIndiaIndonesiaIranIraqIrelandIsraelItalyJamaicaJapanJordanKazakhstanKenyaKoreaKuwaitLaosLatin AmericaLatviaLebanonLiberiaLithuaniaMalaysiaMexicoMiddle AfricaMoldovaMoroccoNepalNetherlandsNicaraguaNigeriaNorthern AfricaNorthern EuropeNorwayOceaniaPakistanPanamaPeruPhilippinesPolandPortugalRomaniaRussiaSaudi ArabiaScotlandSerbiaSierra LeoneSingaporeSouth AfricaSouth AmericaSouth Central AsiaSouth Eastern AsiaSouthern EuropeSpainSri LankaSudanSwedenSwitzerlandSyriaTaiwanThailandTrinidad and TobagoTurkeyUgandaUkraineUruguayUzbekistanVenezuelaVietnamWestern AfricaWestern AsiaWestern EuropeYemenZaireZimbabwe
Immigrant Origin (Percentage)
AfghanistanAfricaAlbaniaArgentinaAsiaAustraliaAustriaBahamasBangladeshBarbadosBelarusBelgiumBelizeBoliviaBosnia and HerzegovinaBrazilBulgariaBurma / MyanmarCambodiaCameroonCanadaCaribbeanCentral AmericaChileChinaColombiaCongoCosta RicaCroatiaCubaCzechoslovakiaDenmarkDominicaDominican RepublicEastern AfricaEastern AsiaEastern EuropeEcuadorEgyptEl SalvadorEnglandEritreaEthiopiaEuropeFranceGermanyGhanaGreeceGuatemalaGuyanaHaitiHondurasHong KongHungaryIndiaIndonesiaIranIraqIrelandIsraelItalyJamaicaJapanJordanKazakhstanKenyaKoreaKuwaitLaosLatin AmericaLatviaLebanonLiberiaLithuaniaMalaysiaMexicoMiddle AfricaMoldovaMoroccoNepalNetherlandsNicaraguaNigeriaNorthern AfricaNorthern EuropeNorwayOceaniaPakistanPanamaPeruPhilippinesPolandPortugalRomaniaRussiaSaudi ArabiaScotlandSerbiaSierra LeoneSingaporeSouth AfricaSouth AmericaSouth Central AsiaSouth Eastern AsiaSouthern EuropeSpainSri LankaSudanSwedenSwitzerlandSyriaTaiwanThailandTrinidad and TobagoTurkeyUgandaUkraineUruguayUzbekistanVenezuelaVietnamWestern AfricaWestern AsiaWestern EuropeYemenZaireZimbabwe
Income
Income (Families)
Income (Households)
Poverty
Poverty (Families)
Unemployment
Employment Occupations
Employment Industries
Employer Class
Commute Time
Commute Means
School Enrollment
Education by Degree Field
Occupancy
Finances
Physical Characteristics
Austin
Compare Zip Codes
Comparison Subject

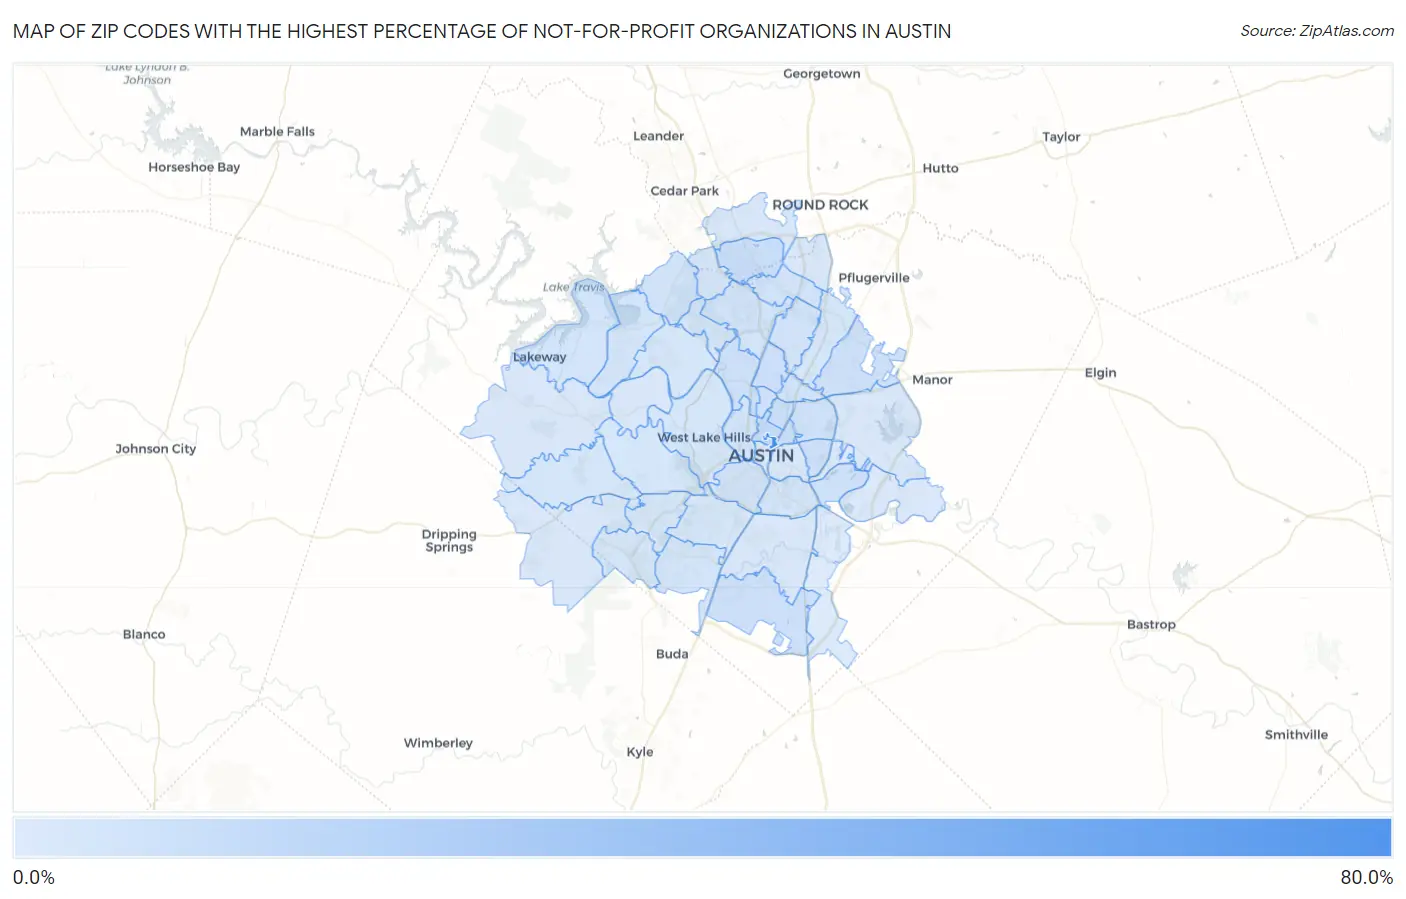
Map of Zip Codes with the Highest Percentage of Not-for-profit Organizations in Austin

0.0%
80.0%
Zip Codes with the Highest Percentage of Not-for-profit Organizations in Austin Map

Zip Codes with the Highest Percentage of Not-for-profit Organizations in Austin, TX

Zip Code % Employed in Not-for-profit vs State vs National
1.7871266.7%5.8%(+60.9)#58.4%(+58.2)#63
2.7870511.4%5.8%(+5.66)#1408.4%(+2.98)#6,434
3.7875110.6%5.8%(+4.82)#1618.4%(+2.13)#7,769
4.7872910.1%5.8%(+4.38)#1768.4%(+1.70)#8,628
5.787229.9%5.8%(+4.15)#1878.4%(+1.46)#9,089
6.787579.3%5.8%(+3.53)#2168.4%(+0.850)#10,369
7.787318.8%5.8%(+3.08)#2488.4%(+0.400)#11,465
8.787478.6%5.8%(+2.79)#2668.4%(+0.107)#12,149
9.787548.4%5.8%(+2.64)#2828.4%(-0.045)#12,564
10.787218.2%5.8%(+2.47)#2988.4%(-0.211)#13,004
11.787238.2%5.8%(+2.43)#3058.4%(-0.254)#13,138
12.787427.9%5.8%(+2.14)#3398.4%(-0.550)#13,917
13.787567.6%5.8%(+1.87)#3658.4%(-0.810)#14,666
14.787587.3%5.8%(+1.58)#4088.4%(-1.11)#15,583
15.787047.1%5.8%(+1.36)#4498.4%(-1.32)#16,206
16.787277.1%5.8%(+1.30)#4528.4%(-1.38)#16,379
17.787596.7%5.8%(+0.960)#5128.4%(-1.72)#17,411
18.787526.7%5.8%(+0.913)#5238.4%(-1.77)#17,548
19.787266.7%5.8%(+0.895)#5298.4%(-1.79)#17,608
20.787486.6%5.8%(+0.818)#5438.4%(-1.87)#17,819
21.787346.5%5.8%(+0.744)#5518.4%(-1.94)#18,015
22.787036.4%5.8%(+0.670)#5738.4%(-2.01)#18,230
23.787326.4%5.8%(+0.658)#5758.4%(-2.03)#18,269
24.787416.3%5.8%(+0.543)#6018.4%(-2.14)#18,622
25.787495.8%5.8%(+0.053)#6898.4%(-2.63)#20,015
26.787395.8%5.8%(+0.041)#6918.4%(-2.64)#20,044
27.787465.8%5.8%(+0.006)#6978.4%(-2.68)#20,163
28.787355.5%5.8%(-0.262)#7668.4%(-2.95)#20,948
29.787505.4%5.8%(-0.391)#7978.4%(-3.08)#21,323
30.787305.3%5.8%(-0.420)#8068.4%(-3.10)#21,398
31.787455.3%5.8%(-0.501)#8248.4%(-3.19)#21,645
32.787535.2%5.8%(-0.527)#8318.4%(-3.21)#21,712
33.787365.1%5.8%(-0.669)#8618.4%(-3.35)#22,094
34.787174.8%5.8%(-0.946)#9158.4%(-3.63)#22,793
35.787334.8%5.8%(-1.01)#9328.4%(-3.69)#22,961
36.787024.7%5.8%(-1.06)#9498.4%(-3.75)#23,088
37.787244.7%5.8%(-1.09)#9548.4%(-3.77)#23,129
38.787384.6%5.8%(-1.16)#9768.4%(-3.85)#23,317
39.787444.4%5.8%(-1.33)#1,0248.4%(-4.01)#23,719
40.787284.4%5.8%(-1.35)#1,0318.4%(-4.03)#23,781
41.787374.3%5.8%(-1.41)#1,0468.4%(-4.10)#23,920
42.787254.0%5.8%(-1.74)#1,1418.4%(-4.43)#24,653
43.787193.4%5.8%(-2.39)#1,2918.4%(-5.07)#25,977
44.787013.1%5.8%(-2.62)#1,3328.4%(-5.30)#26,387

Common Questions

What are the Top 10 Zip Codes with the Highest Percentage of Not-for-profit Organizations in Austin, TX?
Top 10 Zip Codes with the Highest Percentage of Not-for-profit Organizations in Austin, TX are:
#1
66.7%
#2
11.4%
#3
10.6%
#4
10.1%
#5
9.9%
#6
9.3%
#7
8.8%
#8
8.6%
#9
8.4%
#10
8.2%
What zip code has the Highest Percentage of Not-for-profit Organizations in Austin, TX?
78712 has the Highest Percentage of Not-for-profit Organizations in Austin, TX with 66.7%.
What is the Percentage of Not-for-profit Organizations in Austin, TX?
Percentage of Not-for-profit Organizations in Austin is 6.7%.
What is the Percentage of Not-for-profit Organizations in Texas?
Percentage of Not-for-profit Organizations in Texas is 5.8%.
What is the Percentage of Not-for-profit Organizations in the United States?
Percentage of Not-for-profit Organizations in the United States is 8.4%.