Zip Codes with the Highest Percentage of Population Employed in Firefighting & Prevention in Austin, TX
RELATED REPORTS & OPTIONS
Firefighting & Prevention
Austin
Compare Zip Codes
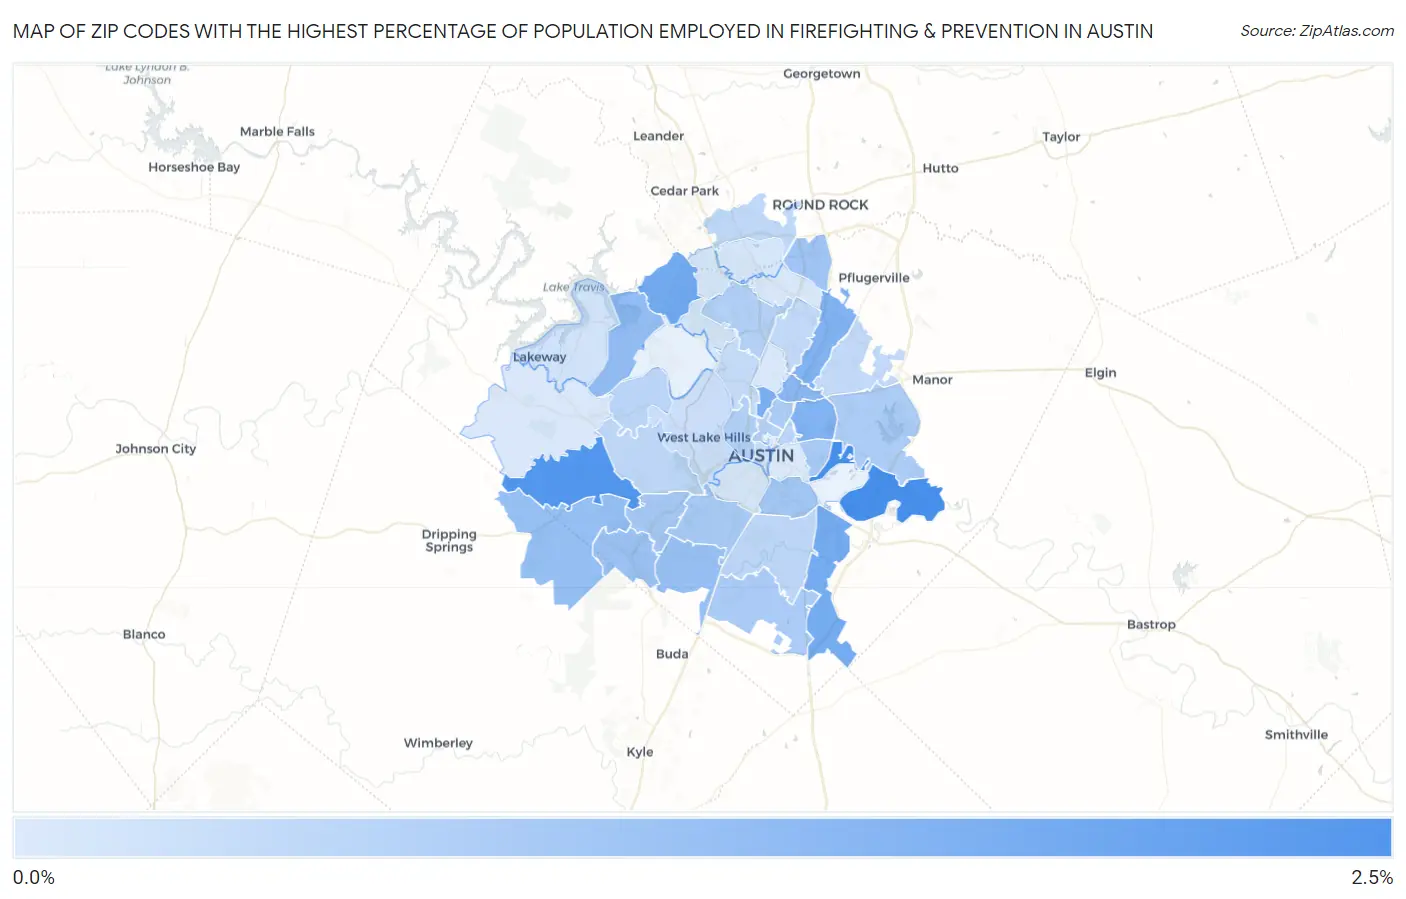
Map of Zip Codes with the Highest Percentage of Population Employed in Firefighting & Prevention in Austin
0.019%
2.4%
Zip Codes with the Highest Percentage of Population Employed in Firefighting & Prevention in Austin, TX
| Zip Code | % Employed | vs State | vs National | |
| 1. | 78725 | 2.4% | 1.1%(+1.28)#210 | 1.2%(+1.23)#3,302 |
| 2. | 78736 | 2.2% | 1.1%(+1.11)#242 | 1.2%(+1.05)#3,744 |
| 3. | 78726 | 1.7% | 1.1%(+0.571)#367 | 1.2%(+0.513)#5,849 |
| 4. | 78719 | 1.7% | 1.1%(+0.558)#370 | 1.2%(+0.501)#5,911 |
| 5. | 78756 | 1.6% | 1.1%(+0.468)#405 | 1.2%(+0.411)#6,400 |
| 6. | 78723 | 1.5% | 1.1%(+0.358)#452 | 1.2%(+0.301)#7,065 |
| 7. | 78753 | 1.5% | 1.1%(+0.339)#458 | 1.2%(+0.282)#7,187 |
| 8. | 78752 | 1.3% | 1.1%(+0.209)#516 | 1.2%(+0.151)#8,077 |
| 9. | 78732 | 1.2% | 1.1%(+0.047)#607 | 1.2%(-0.011)#9,367 |
| 10. | 78737 | 1.2% | 1.1%(+0.023)#619 | 1.2%(-0.034)#9,605 |
| 11. | 78748 | 1.1% | 1.1%(-0.005)#642 | 1.2%(-0.063)#9,887 |
| 12. | 78739 | 1.0% | 1.1%(-0.092)#687 | 1.2%(-0.150)#10,723 |
| 13. | 78728 | 0.97% | 1.1%(-0.156)#730 | 1.2%(-0.213)#11,399 |
| 14. | 78741 | 0.93% | 1.1%(-0.194)#757 | 1.2%(-0.252)#11,795 |
| 15. | 78749 | 0.88% | 1.1%(-0.248)#793 | 1.2%(-0.305)#12,365 |
| 16. | 78745 | 0.87% | 1.1%(-0.259)#802 | 1.2%(-0.316)#12,476 |
| 17. | 78721 | 0.85% | 1.1%(-0.277)#818 | 1.2%(-0.334)#12,656 |
| 18. | 78747 | 0.83% | 1.1%(-0.293)#825 | 1.2%(-0.351)#12,819 |
| 19. | 78724 | 0.79% | 1.1%(-0.336)#850 | 1.2%(-0.393)#13,302 |
| 20. | 78751 | 0.78% | 1.1%(-0.353)#867 | 1.2%(-0.410)#13,482 |
| 21. | 78759 | 0.67% | 1.1%(-0.454)#928 | 1.2%(-0.511)#14,613 |
| 22. | 78703 | 0.67% | 1.1%(-0.460)#938 | 1.2%(-0.518)#14,690 |
| 23. | 78705 | 0.64% | 1.1%(-0.487)#957 | 1.2%(-0.544)#14,989 |
| 24. | 78722 | 0.61% | 1.1%(-0.518)#972 | 1.2%(-0.575)#15,310 |
| 25. | 78733 | 0.55% | 1.1%(-0.575)#1,011 | 1.2%(-0.632)#15,924 |
| 26. | 78735 | 0.54% | 1.1%(-0.588)#1,021 | 1.2%(-0.646)#16,063 |
| 27. | 78744 | 0.53% | 1.1%(-0.598)#1,030 | 1.2%(-0.655)#16,193 |
| 28. | 78717 | 0.50% | 1.1%(-0.633)#1,060 | 1.2%(-0.690)#16,599 |
| 29. | 78754 | 0.47% | 1.1%(-0.661)#1,078 | 1.2%(-0.719)#16,919 |
| 30. | 78758 | 0.44% | 1.1%(-0.684)#1,093 | 1.2%(-0.741)#17,169 |
| 31. | 78731 | 0.40% | 1.1%(-0.726)#1,117 | 1.2%(-0.783)#17,626 |
| 32. | 78746 | 0.31% | 1.1%(-0.816)#1,165 | 1.2%(-0.873)#18,629 |
| 33. | 78701 | 0.23% | 1.1%(-0.901)#1,209 | 1.2%(-0.958)#19,436 |
| 34. | 78734 | 0.19% | 1.1%(-0.942)#1,238 | 1.2%(-1.000)#19,793 |
| 35. | 78750 | 0.13% | 1.1%(-0.999)#1,261 | 1.2%(-1.06)#20,167 |
| 36. | 78729 | 0.13% | 1.1%(-1.00)#1,265 | 1.2%(-1.06)#20,191 |
| 37. | 78704 | 0.11% | 1.1%(-1.01)#1,269 | 1.2%(-1.07)#20,241 |
| 38. | 78757 | 0.089% | 1.1%(-1.04)#1,274 | 1.2%(-1.10)#20,352 |
| 39. | 78727 | 0.084% | 1.1%(-1.04)#1,277 | 1.2%(-1.10)#20,380 |
| 40. | 78738 | 0.060% | 1.1%(-1.07)#1,288 | 1.2%(-1.13)#20,476 |
| 41. | 78702 | 0.019% | 1.1%(-1.11)#1,291 | 1.2%(-1.17)#20,545 |
1
Common Questions
What are the Top 10 Zip Codes with the Highest Percentage of Population Employed in Firefighting & Prevention in Austin, TX?
Top 10 Zip Codes with the Highest Percentage of Population Employed in Firefighting & Prevention in Austin, TX are:
What zip code has the Highest Percentage of Population Employed in Firefighting & Prevention in Austin, TX?
78725 has the Highest Percentage of Population Employed in Firefighting & Prevention in Austin, TX with 2.4%.
What is the Percentage of Population Employed in Firefighting & Prevention in Austin, TX?
Percentage of Population Employed in Firefighting & Prevention in Austin is 0.69%.
What is the Percentage of Population Employed in Firefighting & Prevention in Texas?
Percentage of Population Employed in Firefighting & Prevention in Texas is 1.1%.
What is the Percentage of Population Employed in Firefighting & Prevention in the United States?
Percentage of Population Employed in Firefighting & Prevention in the United States is 1.2%.