Zip Codes with the Highest Percentage of Households with Income Above $200,000 in Harlingen, TX
RELATED REPORTS & OPTIONS
Household Income | $200k+
Harlingen
Compare Zip Codes
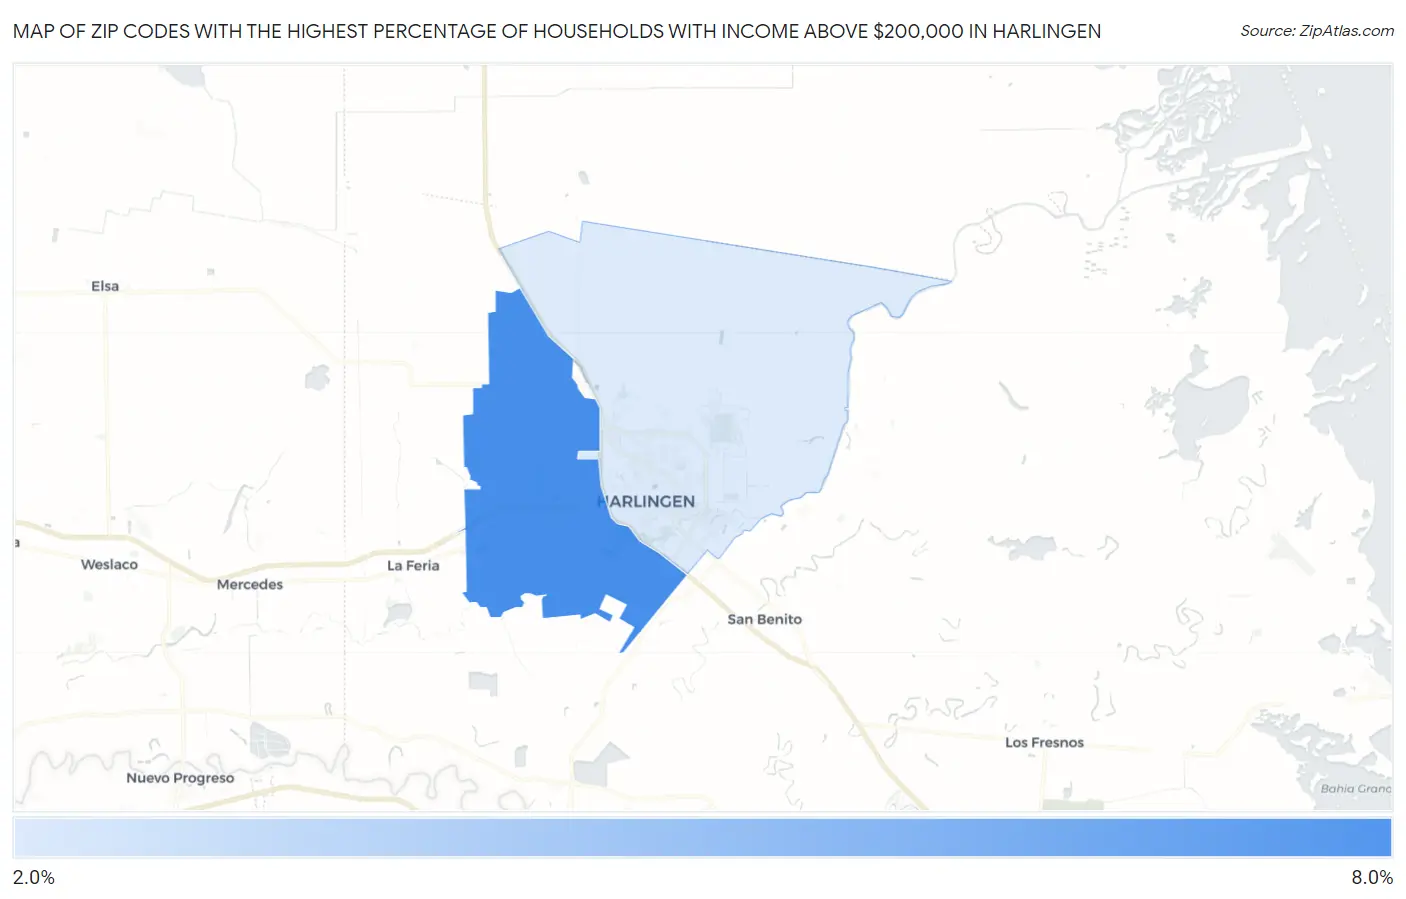
Map of Zip Codes with the Highest Percentage of Households with Income Above $200,000 in Harlingen
2.5%
6.4%
Zip Codes with the Highest Percentage of Households with Income Above $200,000 in Harlingen, TX
| Zip Code | Households with Income > $200k | vs State | vs National | |
| 1. | 78552 | 6.4% | 10.6%(-4.20)#767 | 11.4%(-5.00)#12,714 |
| 2. | 78550 | 2.5% | 10.6%(-8.10)#1,333 | 11.4%(-8.90)#22,308 |
1
Common Questions
What are the Top Zip Codes with the Highest Percentage of Households with Income Above $200,000 in Harlingen, TX?
Top Zip Codes with the Highest Percentage of Households with Income Above $200,000 in Harlingen, TX are:
What zip code has the Highest Percentage of Households with Income Above $200,000 in Harlingen, TX?
78552 has the Highest Percentage of Households with Income Above $200,000 in Harlingen, TX with 6.4%.
What is the Percentage of Households with Income Above $200,000 in Harlingen, TX?
Percentage of Households with Income Above $200,000 in Harlingen is 3.7%.
What is the Percentage of Households with Income Above $200,000 in Texas?
Percentage of Households with Income Above $200,000 in Texas is 10.6%.
What is the Percentage of Households with Income Above $200,000 in the United States?
Percentage of Households with Income Above $200,000 in the United States is 11.4%.