Zip Codes with the Highest Percentage of Population Employed in Office & Administration in Austin, TX
RELATED REPORTS & OPTIONS
Office & Administration
Austin
Compare Zip Codes
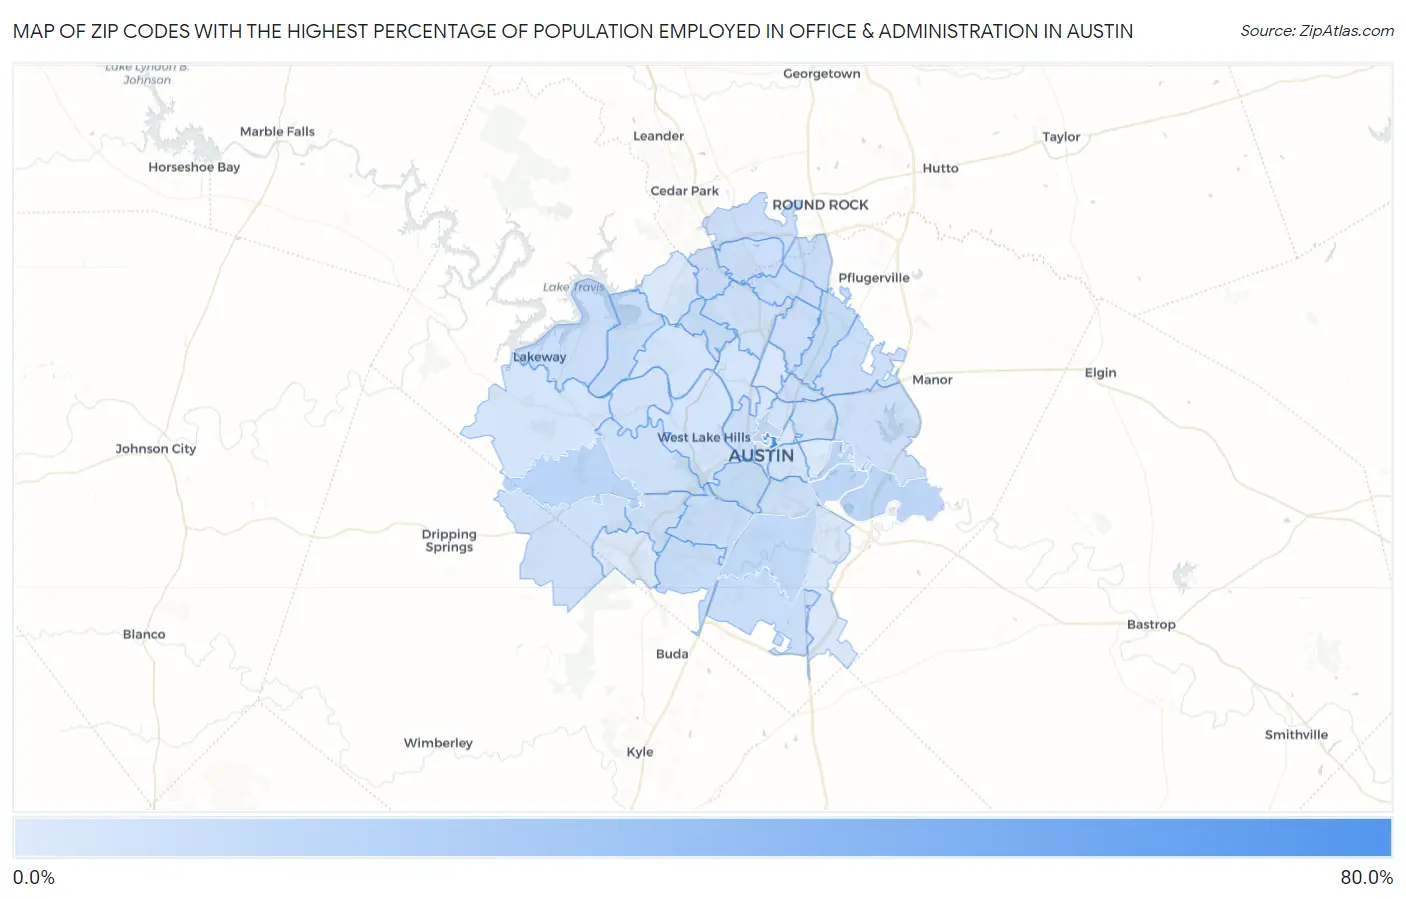
Map of Zip Codes with the Highest Percentage of Population Employed in Office & Administration in Austin
3.2%
66.7%
Zip Codes with the Highest Percentage of Population Employed in Office & Administration in Austin, TX
| Zip Code | % Employed | vs State | vs National | |
| 1. | 78712 | 66.7% | 11.0%(+55.7)#6 | 10.9%(+55.8)#52 |
| 2. | 78736 | 14.8% | 11.0%(+3.86)#291 | 10.9%(+3.97)#4,793 |
| 3. | 78725 | 14.7% | 11.0%(+3.69)#303 | 10.9%(+3.81)#5,028 |
| 4. | 78742 | 14.1% | 11.0%(+3.15)#354 | 10.9%(+3.27)#5,818 |
| 5. | 78705 | 12.8% | 11.0%(+1.85)#531 | 10.9%(+1.96)#8,496 |
| 6. | 78744 | 12.4% | 11.0%(+1.42)#600 | 10.9%(+1.53)#9,588 |
| 7. | 78704 | 11.0% | 11.0%(+0.054)#825 | 10.9%(+0.169)#13,751 |
| 8. | 78753 | 10.8% | 11.0%(-0.212)#880 | 10.9%(-0.097)#14,623 |
| 9. | 78728 | 10.6% | 11.0%(-0.407)#912 | 10.9%(-0.292)#15,253 |
| 10. | 78748 | 10.2% | 11.0%(-0.764)#992 | 10.9%(-0.649)#16,458 |
| 11. | 78745 | 10.1% | 11.0%(-0.864)#1,015 | 10.9%(-0.748)#16,771 |
| 12. | 78747 | 10.1% | 11.0%(-0.917)#1,027 | 10.9%(-0.802)#16,953 |
| 13. | 78732 | 9.9% | 11.0%(-1.04)#1,052 | 10.9%(-0.924)#17,339 |
| 14. | 78727 | 9.9% | 11.0%(-1.04)#1,053 | 10.9%(-0.927)#17,346 |
| 15. | 78734 | 9.7% | 11.0%(-1.29)#1,117 | 10.9%(-1.18)#18,149 |
| 16. | 78729 | 9.4% | 11.0%(-1.54)#1,158 | 10.9%(-1.43)#18,971 |
| 17. | 78758 | 9.3% | 11.0%(-1.66)#1,175 | 10.9%(-1.54)#19,327 |
| 18. | 78717 | 9.3% | 11.0%(-1.70)#1,183 | 10.9%(-1.58)#19,462 |
| 19. | 78752 | 9.3% | 11.0%(-1.70)#1,185 | 10.9%(-1.59)#19,475 |
| 20. | 78750 | 9.2% | 11.0%(-1.82)#1,199 | 10.9%(-1.70)#19,780 |
| 21. | 78749 | 8.8% | 11.0%(-2.19)#1,255 | 10.9%(-2.08)#20,916 |
| 22. | 78754 | 8.5% | 11.0%(-2.46)#1,296 | 10.9%(-2.34)#21,658 |
| 23. | 78741 | 8.3% | 11.0%(-2.64)#1,325 | 10.9%(-2.53)#22,162 |
| 24. | 78724 | 8.2% | 11.0%(-2.74)#1,343 | 10.9%(-2.62)#22,420 |
| 25. | 78737 | 8.2% | 11.0%(-2.77)#1,347 | 10.9%(-2.66)#22,528 |
| 26. | 78735 | 8.1% | 11.0%(-2.87)#1,367 | 10.9%(-2.76)#22,785 |
| 27. | 78723 | 7.8% | 11.0%(-3.14)#1,401 | 10.9%(-3.02)#23,406 |
| 28. | 78703 | 7.7% | 11.0%(-3.26)#1,415 | 10.9%(-3.15)#23,674 |
| 29. | 78759 | 7.6% | 11.0%(-3.37)#1,427 | 10.9%(-3.26)#23,935 |
| 30. | 78733 | 7.4% | 11.0%(-3.58)#1,451 | 10.9%(-3.47)#24,426 |
| 31. | 78751 | 7.0% | 11.0%(-3.99)#1,498 | 10.9%(-3.88)#25,246 |
| 32. | 78702 | 6.6% | 11.0%(-4.41)#1,535 | 10.9%(-4.29)#25,996 |
| 33. | 78730 | 6.3% | 11.0%(-4.66)#1,559 | 10.9%(-4.55)#26,398 |
| 34. | 78738 | 6.2% | 11.0%(-4.79)#1,567 | 10.9%(-4.68)#26,583 |
| 35. | 78746 | 6.0% | 11.0%(-4.93)#1,577 | 10.9%(-4.81)#26,784 |
| 36. | 78731 | 6.0% | 11.0%(-4.93)#1,579 | 10.9%(-4.82)#26,798 |
| 37. | 78756 | 5.3% | 11.0%(-5.71)#1,629 | 10.9%(-5.60)#27,847 |
| 38. | 78757 | 4.7% | 11.0%(-6.24)#1,652 | 10.9%(-6.12)#28,334 |
| 39. | 78719 | 4.6% | 11.0%(-6.39)#1,658 | 10.9%(-6.28)#28,498 |
| 40. | 78722 | 4.6% | 11.0%(-6.40)#1,659 | 10.9%(-6.29)#28,510 |
| 41. | 78701 | 3.6% | 11.0%(-7.37)#1,697 | 10.9%(-7.25)#29,298 |
| 42. | 78726 | 3.6% | 11.0%(-7.41)#1,699 | 10.9%(-7.30)#29,325 |
| 43. | 78739 | 3.3% | 11.0%(-7.65)#1,708 | 10.9%(-7.54)#29,478 |
| 44. | 78721 | 3.2% | 11.0%(-7.82)#1,715 | 10.9%(-7.70)#29,578 |
1
Common Questions
What are the Top 10 Zip Codes with the Highest Percentage of Population Employed in Office & Administration in Austin, TX?
Top 10 Zip Codes with the Highest Percentage of Population Employed in Office & Administration in Austin, TX are:
What zip code has the Highest Percentage of Population Employed in Office & Administration in Austin, TX?
78712 has the Highest Percentage of Population Employed in Office & Administration in Austin, TX with 66.7%.
What is the Percentage of Population Employed in Office & Administration in Austin, TX?
Percentage of Population Employed in Office & Administration in Austin is 8.9%.
What is the Percentage of Population Employed in Office & Administration in Texas?
Percentage of Population Employed in Office & Administration in Texas is 11.0%.
What is the Percentage of Population Employed in Office & Administration in the United States?
Percentage of Population Employed in Office & Administration in the United States is 10.9%.