Zip Codes with the Highest Percentage of Households with Income Above $100,000 in Austin, TX
RELATED REPORTS & OPTIONS
Household Income | $100k+
Austin
Compare Zip Codes
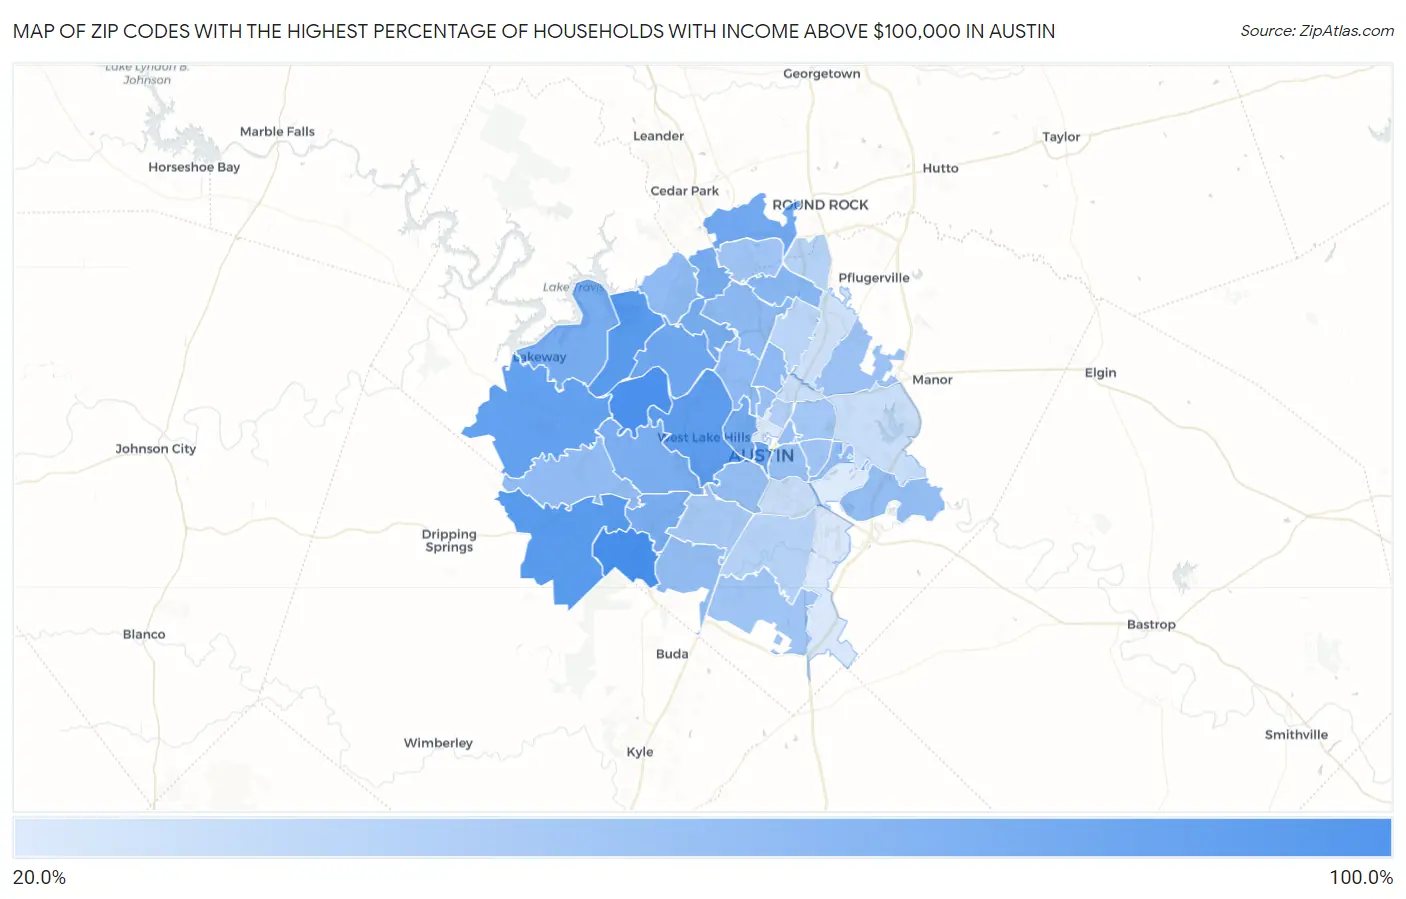
Map of Zip Codes with the Highest Percentage of Households with Income Above $100,000 in Austin
20.1%
81.6%
Zip Codes with the Highest Percentage of Households with Income Above $100,000 in Austin, TX
| Zip Code | Households with Income > $100k | vs State | vs National | |
| 1. | 78739 | 81.6% | 36.2%(+45.4)#26 | 37.3%(+44.3)#289 |
| 2. | 78733 | 80.5% | 36.2%(+44.3)#28 | 37.3%(+43.2)#328 |
| 3. | 78737 | 73.7% | 36.2%(+37.5)#43 | 37.3%(+36.4)#658 |
| 4. | 78732 | 73.2% | 36.2%(+37.0)#45 | 37.3%(+35.9)#687 |
| 5. | 78746 | 70.2% | 36.2%(+34.0)#56 | 37.3%(+32.9)#944 |
| 6. | 78738 | 67.8% | 36.2%(+31.6)#64 | 37.3%(+30.5)#1,186 |
| 7. | 78701 | 64.7% | 36.2%(+28.5)#78 | 37.3%(+27.4)#1,579 |
| 8. | 78730 | 62.9% | 36.2%(+26.7)#94 | 37.3%(+25.6)#1,867 |
| 9. | 78717 | 61.7% | 36.2%(+25.5)#103 | 37.3%(+24.4)#2,048 |
| 10. | 78703 | 61.0% | 36.2%(+24.8)#108 | 37.3%(+23.7)#2,178 |
| 11. | 78734 | 59.3% | 36.2%(+23.1)#125 | 37.3%(+22.0)#2,501 |
| 12. | 78750 | 58.4% | 36.2%(+22.2)#130 | 37.3%(+21.1)#2,685 |
| 13. | 78749 | 57.6% | 36.2%(+21.4)#139 | 37.3%(+20.3)#2,841 |
| 14. | 78735 | 57.4% | 36.2%(+21.2)#140 | 37.3%(+20.1)#2,891 |
| 15. | 78727 | 52.3% | 36.2%(+16.1)#215 | 37.3%(+15.0)#4,160 |
| 16. | 78726 | 49.2% | 36.2%(+13.0)#266 | 37.3%(+11.9)#5,108 |
| 17. | 78757 | 49.1% | 36.2%(+12.9)#267 | 37.3%(+11.8)#5,136 |
| 18. | 78759 | 49.0% | 36.2%(+12.8)#268 | 37.3%(+11.7)#5,162 |
| 19. | 78731 | 48.9% | 36.2%(+12.7)#270 | 37.3%(+11.6)#5,197 |
| 20. | 78736 | 48.3% | 36.2%(+12.1)#276 | 37.3%(+11.0)#5,392 |
| 21. | 78748 | 47.4% | 36.2%(+11.2)#287 | 37.3%(+10.1)#5,691 |
| 22. | 78725 | 47.3% | 36.2%(+11.1)#290 | 37.3%(+10.00)#5,741 |
| 23. | 78702 | 46.4% | 36.2%(+10.2)#305 | 37.3%(+9.10)#6,043 |
| 24. | 78756 | 46.0% | 36.2%(+9.80)#318 | 37.3%(+8.70)#6,214 |
| 25. | 78704 | 45.9% | 36.2%(+9.70)#320 | 37.3%(+8.60)#6,238 |
| 26. | 78722 | 45.7% | 36.2%(+9.50)#332 | 37.3%(+8.40)#6,340 |
| 27. | 78754 | 43.4% | 36.2%(+7.20)#378 | 37.3%(+6.10)#7,242 |
| 28. | 78747 | 42.7% | 36.2%(+6.50)#401 | 37.3%(+5.40)#7,576 |
| 29. | 78721 | 41.9% | 36.2%(+5.70)#428 | 37.3%(+4.60)#7,935 |
| 30. | 78729 | 41.4% | 36.2%(+5.20)#445 | 37.3%(+4.10)#8,154 |
| 31. | 78723 | 41.1% | 36.2%(+4.90)#458 | 37.3%(+3.80)#8,333 |
| 32. | 78745 | 39.6% | 36.2%(+3.40)#494 | 37.3%(+2.30)#9,116 |
| 33. | 78751 | 36.1% | 36.2%(-0.100)#615 | 37.3%(-1.20)#11,080 |
| 34. | 78728 | 33.8% | 36.2%(-2.40)#707 | 37.3%(-3.50)#12,573 |
| 35. | 78744 | 33.4% | 36.2%(-2.80)#724 | 37.3%(-3.90)#12,809 |
| 36. | 78758 | 32.2% | 36.2%(-4.00)#776 | 37.3%(-5.10)#13,687 |
| 37. | 78741 | 27.4% | 36.2%(-8.80)#998 | 37.3%(-9.90)#17,625 |
| 38. | 78724 | 27.3% | 36.2%(-8.90)#1,002 | 37.3%(-10.00)#17,703 |
| 39. | 78752 | 26.9% | 36.2%(-9.30)#1,034 | 37.3%(-10.4)#18,060 |
| 40. | 78753 | 24.7% | 36.2%(-11.5)#1,135 | 37.3%(-12.6)#19,993 |
| 41. | 78719 | 20.9% | 36.2%(-15.3)#1,367 | 37.3%(-16.4)#23,369 |
| 42. | 78705 | 20.3% | 36.2%(-15.9)#1,392 | 37.3%(-17.0)#23,787 |
| 43. | 78742 | 20.1% | 36.2%(-16.1)#1,404 | 37.3%(-17.2)#23,987 |
1
Common Questions
What are the Top 10 Zip Codes with the Highest Percentage of Households with Income Above $100,000 in Austin, TX?
Top 10 Zip Codes with the Highest Percentage of Households with Income Above $100,000 in Austin, TX are:
What zip code has the Highest Percentage of Households with Income Above $100,000 in Austin, TX?
78739 has the Highest Percentage of Households with Income Above $100,000 in Austin, TX with 81.6%.
What is the Percentage of Households with Income Above $100,000 in Austin, TX?
Percentage of Households with Income Above $100,000 in Austin is 43.5%.
What is the Percentage of Households with Income Above $100,000 in Texas?
Percentage of Households with Income Above $100,000 in Texas is 36.2%.
What is the Percentage of Households with Income Above $100,000 in the United States?
Percentage of Households with Income Above $100,000 in the United States is 37.3%.