Zip Codes with the Highest Percentage of Households with Income Above $200,000 in Edinburg, TX
RELATED REPORTS & OPTIONS
Household Income | $200k+
Edinburg
Compare Zip Codes
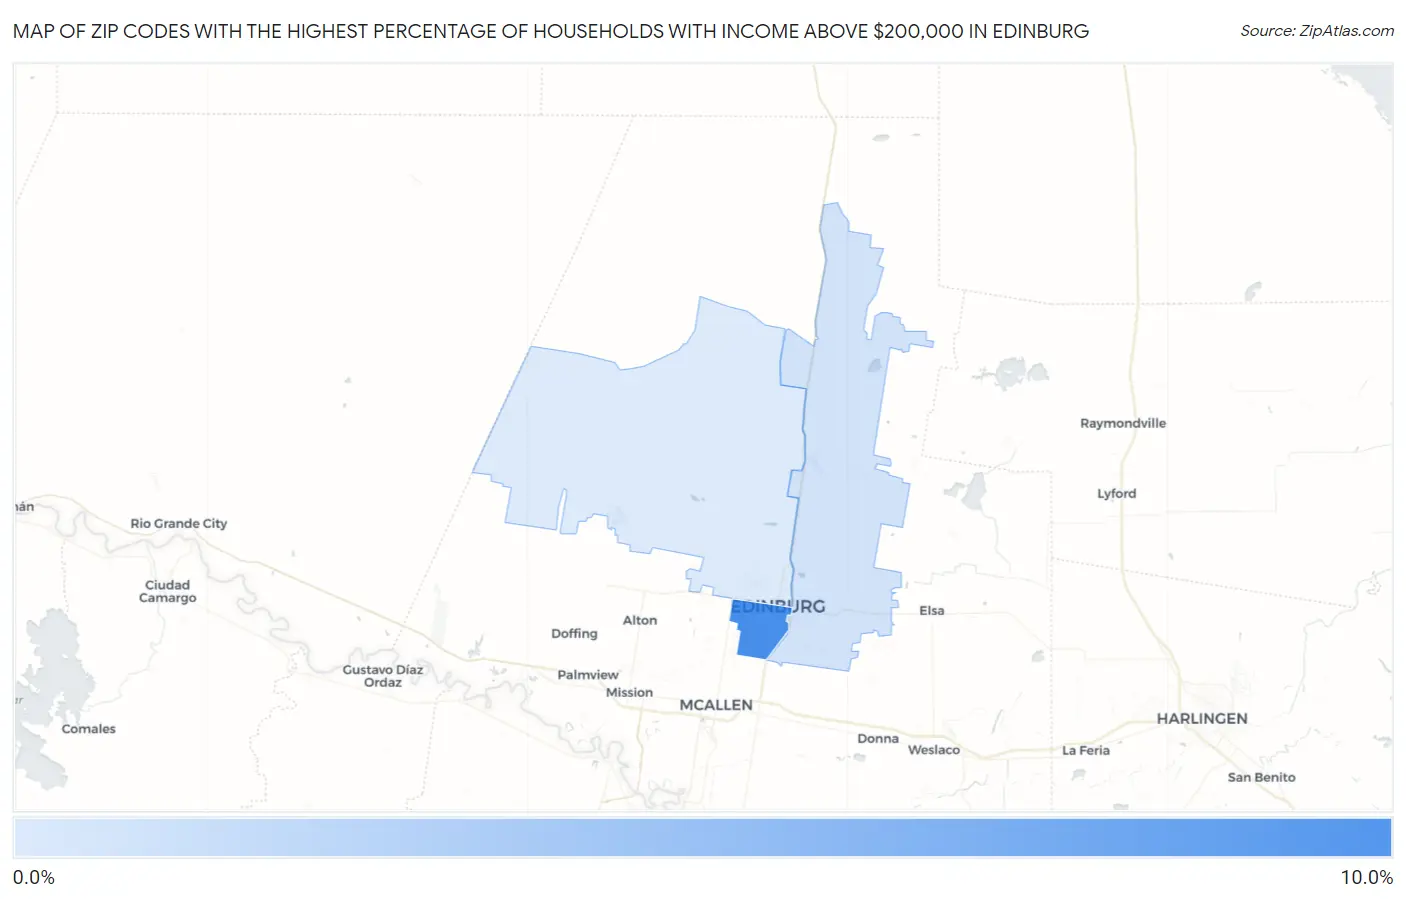
Map of Zip Codes with the Highest Percentage of Households with Income Above $200,000 in Edinburg
1.4%
8.7%
Zip Codes with the Highest Percentage of Households with Income Above $200,000 in Edinburg, TX
| Zip Code | Households with Income > $200k | vs State | vs National | |
| 1. | 78539 | 8.7% | 10.6%(-1.90)#547 | 11.4%(-2.70)#9,521 |
| 2. | 78542 | 1.9% | 10.6%(-8.70)#1,433 | 11.4%(-9.50)#24,026 |
| 3. | 78541 | 1.4% | 10.6%(-9.20)#1,504 | 11.4%(-10.00)#25,282 |
1
Common Questions
What are the Top Zip Codes with the Highest Percentage of Households with Income Above $200,000 in Edinburg, TX?
Top Zip Codes with the Highest Percentage of Households with Income Above $200,000 in Edinburg, TX are:
What zip code has the Highest Percentage of Households with Income Above $200,000 in Edinburg, TX?
78539 has the Highest Percentage of Households with Income Above $200,000 in Edinburg, TX with 8.7%.
What is the Percentage of Households with Income Above $200,000 in Edinburg, TX?
Percentage of Households with Income Above $200,000 in Edinburg is 4.1%.
What is the Percentage of Households with Income Above $200,000 in Texas?
Percentage of Households with Income Above $200,000 in Texas is 10.6%.
What is the Percentage of Households with Income Above $200,000 in the United States?
Percentage of Households with Income Above $200,000 in the United States is 11.4%.