Zip Codes with the Highest Percentage of Households with Income Above $200,000 in Duncanville, TX
RELATED REPORTS & OPTIONS
Household Income | $200k+
Duncanville
Compare Zip Codes
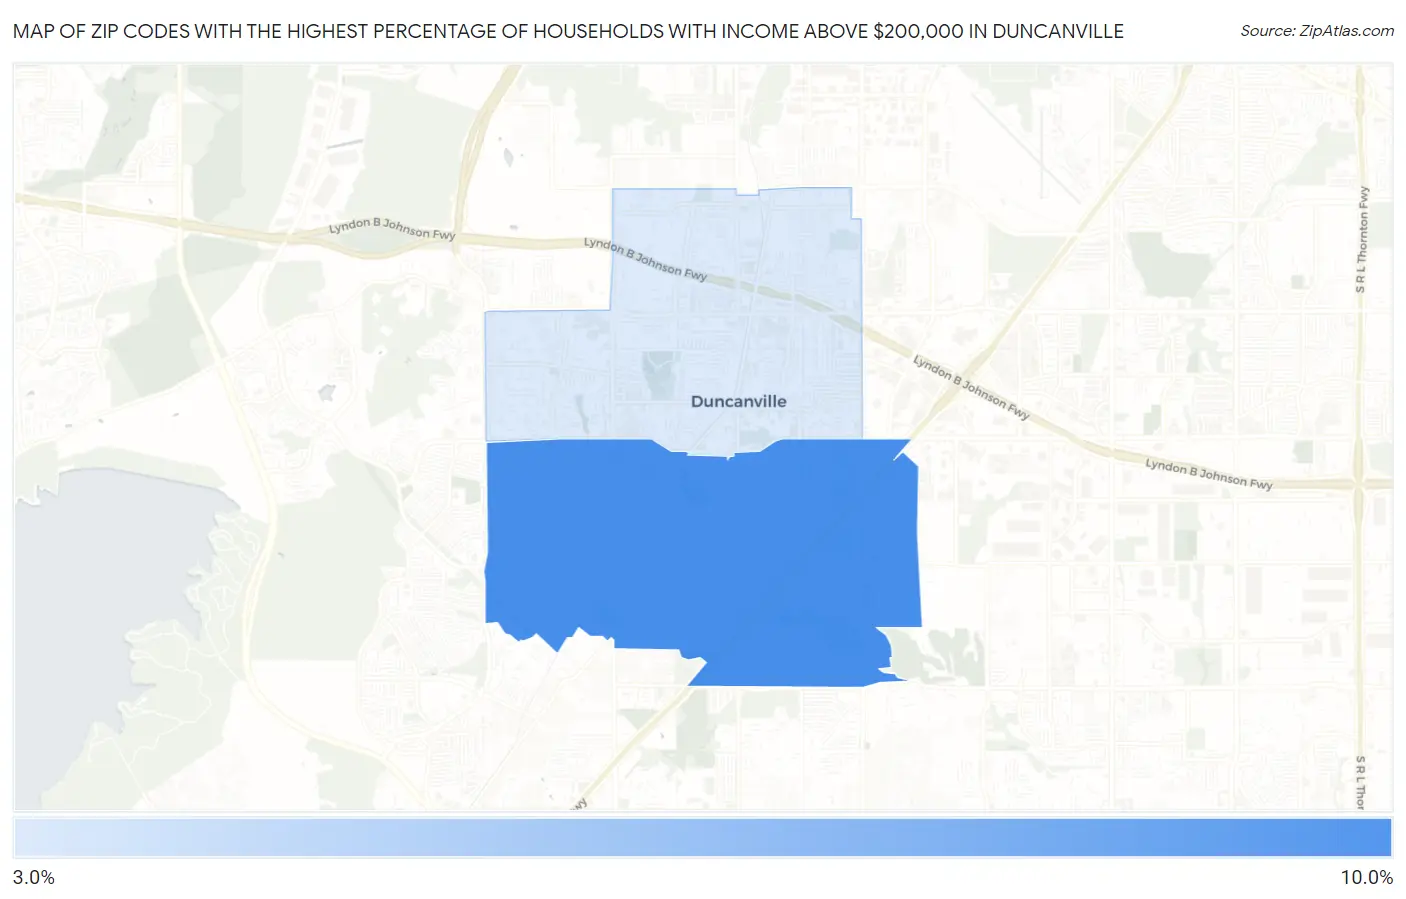
Map of Zip Codes with the Highest Percentage of Households with Income Above $200,000 in Duncanville
3.3%
8.8%
Zip Codes with the Highest Percentage of Households with Income Above $200,000 in Duncanville, TX
| Zip Code | Households with Income > $200k | vs State | vs National | |
| 1. | 75137 | 8.8% | 10.6%(-1.80)#545 | 11.4%(-2.60)#9,432 |
| 2. | 75116 | 3.3% | 10.6%(-7.30)#1,213 | 11.4%(-8.10)#20,041 |
1
Common Questions
What are the Top Zip Codes with the Highest Percentage of Households with Income Above $200,000 in Duncanville, TX?
Top Zip Codes with the Highest Percentage of Households with Income Above $200,000 in Duncanville, TX are:
What zip code has the Highest Percentage of Households with Income Above $200,000 in Duncanville, TX?
75137 has the Highest Percentage of Households with Income Above $200,000 in Duncanville, TX with 8.8%.
What is the Percentage of Households with Income Above $200,000 in Duncanville, TX?
Percentage of Households with Income Above $200,000 in Duncanville is 6.2%.
What is the Percentage of Households with Income Above $200,000 in Texas?
Percentage of Households with Income Above $200,000 in Texas is 10.6%.
What is the Percentage of Households with Income Above $200,000 in the United States?
Percentage of Households with Income Above $200,000 in the United States is 11.4%.