Zip Codes with the Highest Percentage of Population with a Degree in Liberal Arts and History in Austin, TX
RELATED REPORTS & OPTIONS
Liberal Arts and History
Austin
Compare Zip Codes
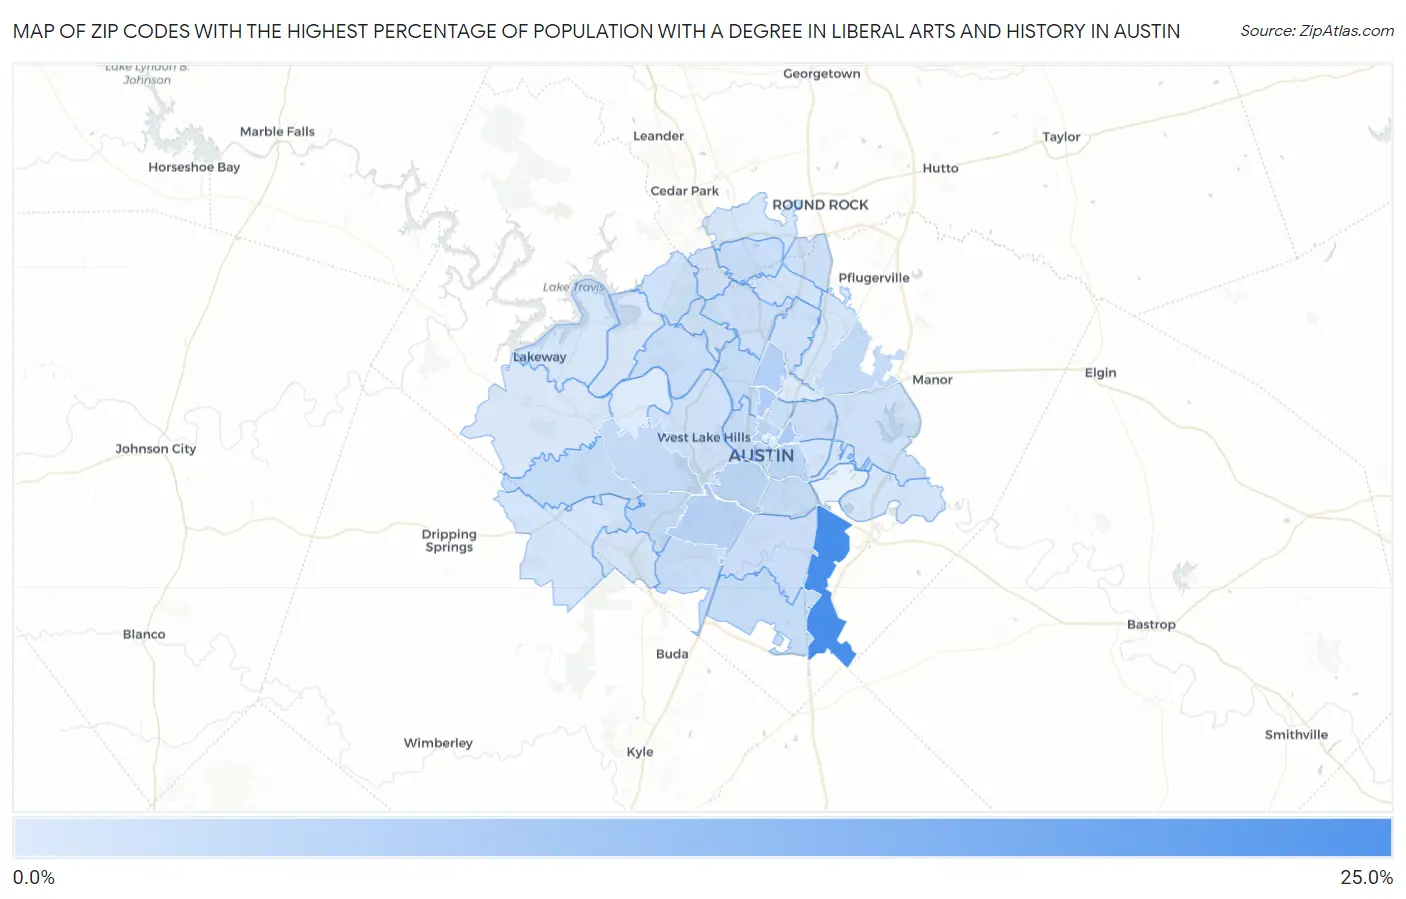
Map of Zip Codes with the Highest Percentage of Population with a Degree in Liberal Arts and History in Austin
2.0%
24.2%
Zip Codes with the Highest Percentage of Population with a Degree in Liberal Arts and History in Austin, TX
| Zip Code | % Graduates | vs State | vs National | |
| 1. | 78719 | 24.2% | 4.2%(+20.0)#25 | 4.9%(+19.3)#622 |
| 2. | 78722 | 9.1% | 4.2%(+4.92)#186 | 4.9%(+4.19)#3,793 |
| 3. | 78756 | 8.1% | 4.2%(+3.94)#230 | 4.9%(+3.22)#4,793 |
| 4. | 78757 | 7.6% | 4.2%(+3.45)#267 | 4.9%(+2.73)#5,433 |
| 5. | 78745 | 7.2% | 4.2%(+3.02)#299 | 4.9%(+2.30)#6,103 |
| 6. | 78704 | 6.5% | 4.2%(+2.31)#368 | 4.9%(+1.58)#7,435 |
| 7. | 78702 | 6.3% | 4.2%(+2.11)#394 | 4.9%(+1.39)#7,877 |
| 8. | 78705 | 5.9% | 4.2%(+1.79)#431 | 4.9%(+1.06)#8,682 |
| 9. | 78735 | 5.5% | 4.2%(+1.37)#494 | 4.9%(+0.645)#9,826 |
| 10. | 78754 | 5.4% | 4.2%(+1.28)#508 | 4.9%(+0.560)#10,056 |
| 11. | 78747 | 5.2% | 4.2%(+1.06)#538 | 4.9%(+0.334)#10,707 |
| 12. | 78741 | 5.2% | 4.2%(+1.05)#539 | 4.9%(+0.331)#10,716 |
| 13. | 78731 | 5.2% | 4.2%(+1.00)#544 | 4.9%(+0.281)#10,865 |
| 14. | 78736 | 5.0% | 4.2%(+0.855)#565 | 4.9%(+0.134)#11,315 |
| 15. | 78749 | 5.0% | 4.2%(+0.810)#572 | 4.9%(+0.089)#11,467 |
| 16. | 78730 | 4.9% | 4.2%(+0.771)#582 | 4.9%(+0.049)#11,583 |
| 17. | 78748 | 4.9% | 4.2%(+0.758)#584 | 4.9%(+0.037)#11,611 |
| 18. | 78729 | 4.9% | 4.2%(+0.737)#590 | 4.9%(+0.015)#11,676 |
| 19. | 78703 | 4.9% | 4.2%(+0.715)#596 | 4.9%(-0.007)#11,768 |
| 20. | 78701 | 4.8% | 4.2%(+0.673)#605 | 4.9%(-0.049)#11,910 |
| 21. | 78744 | 4.6% | 4.2%(+0.465)#641 | 4.9%(-0.256)#12,595 |
| 22. | 78751 | 4.6% | 4.2%(+0.454)#642 | 4.9%(-0.268)#12,632 |
| 23. | 78723 | 4.4% | 4.2%(+0.202)#699 | 4.9%(-0.519)#13,441 |
| 24. | 78759 | 4.2% | 4.2%(+0.041)#733 | 4.9%(-0.680)#14,042 |
| 25. | 78728 | 4.2% | 4.2%(+0.006)#753 | 4.9%(-0.715)#14,188 |
| 26. | 78726 | 4.0% | 4.2%(-0.151)#785 | 4.9%(-0.872)#14,768 |
| 27. | 78746 | 3.9% | 4.2%(-0.284)#815 | 4.9%(-1.01)#15,275 |
| 28. | 78758 | 3.8% | 4.2%(-0.371)#835 | 4.9%(-1.09)#15,600 |
| 29. | 78724 | 3.7% | 4.2%(-0.421)#841 | 4.9%(-1.14)#15,783 |
| 30. | 78727 | 3.5% | 4.2%(-0.667)#903 | 4.9%(-1.39)#16,650 |
| 31. | 78750 | 3.5% | 4.2%(-0.692)#917 | 4.9%(-1.41)#16,752 |
| 32. | 78737 | 3.4% | 4.2%(-0.781)#939 | 4.9%(-1.50)#17,079 |
| 33. | 78725 | 3.2% | 4.2%(-0.979)#981 | 4.9%(-1.70)#17,754 |
| 34. | 78721 | 3.1% | 4.2%(-1.01)#987 | 4.9%(-1.74)#17,872 |
| 35. | 78753 | 2.9% | 4.2%(-1.24)#1,035 | 4.9%(-1.96)#18,658 |
| 36. | 78739 | 2.9% | 4.2%(-1.27)#1,043 | 4.9%(-1.99)#18,743 |
| 37. | 78734 | 2.9% | 4.2%(-1.28)#1,049 | 4.9%(-2.00)#18,786 |
| 38. | 78717 | 2.8% | 4.2%(-1.33)#1,056 | 4.9%(-2.05)#18,940 |
| 39. | 78732 | 2.7% | 4.2%(-1.46)#1,084 | 4.9%(-2.18)#19,343 |
| 40. | 78738 | 2.5% | 4.2%(-1.67)#1,141 | 4.9%(-2.39)#20,060 |
| 41. | 78733 | 2.1% | 4.2%(-2.05)#1,219 | 4.9%(-2.77)#21,086 |
| 42. | 78752 | 2.0% | 4.2%(-2.18)#1,245 | 4.9%(-2.90)#21,438 |
1
Common Questions
What are the Top 10 Zip Codes with the Highest Percentage of Population with a Degree in Liberal Arts and History in Austin, TX?
Top 10 Zip Codes with the Highest Percentage of Population with a Degree in Liberal Arts and History in Austin, TX are:
What zip code has the Highest Percentage of Population with a Degree in Liberal Arts and History in Austin, TX?
78719 has the Highest Percentage of Population with a Degree in Liberal Arts and History in Austin, TX with 24.2%.
What is the Percentage of Population with a Degree in Liberal Arts and History in Austin, TX?
Percentage of Population with a Degree in Liberal Arts and History in Austin is 4.9%.
What is the Percentage of Population with a Degree in Liberal Arts and History in Texas?
Percentage of Population with a Degree in Liberal Arts and History in Texas is 4.2%.
What is the Percentage of Population with a Degree in Liberal Arts and History in the United States?
Percentage of Population with a Degree in Liberal Arts and History in the United States is 4.9%.