Zip Codes with the Highest Percentage of Population with a Degree in Engineering in Austin, TX
RELATED REPORTS & OPTIONS
Engineering
Austin
Compare Zip Codes
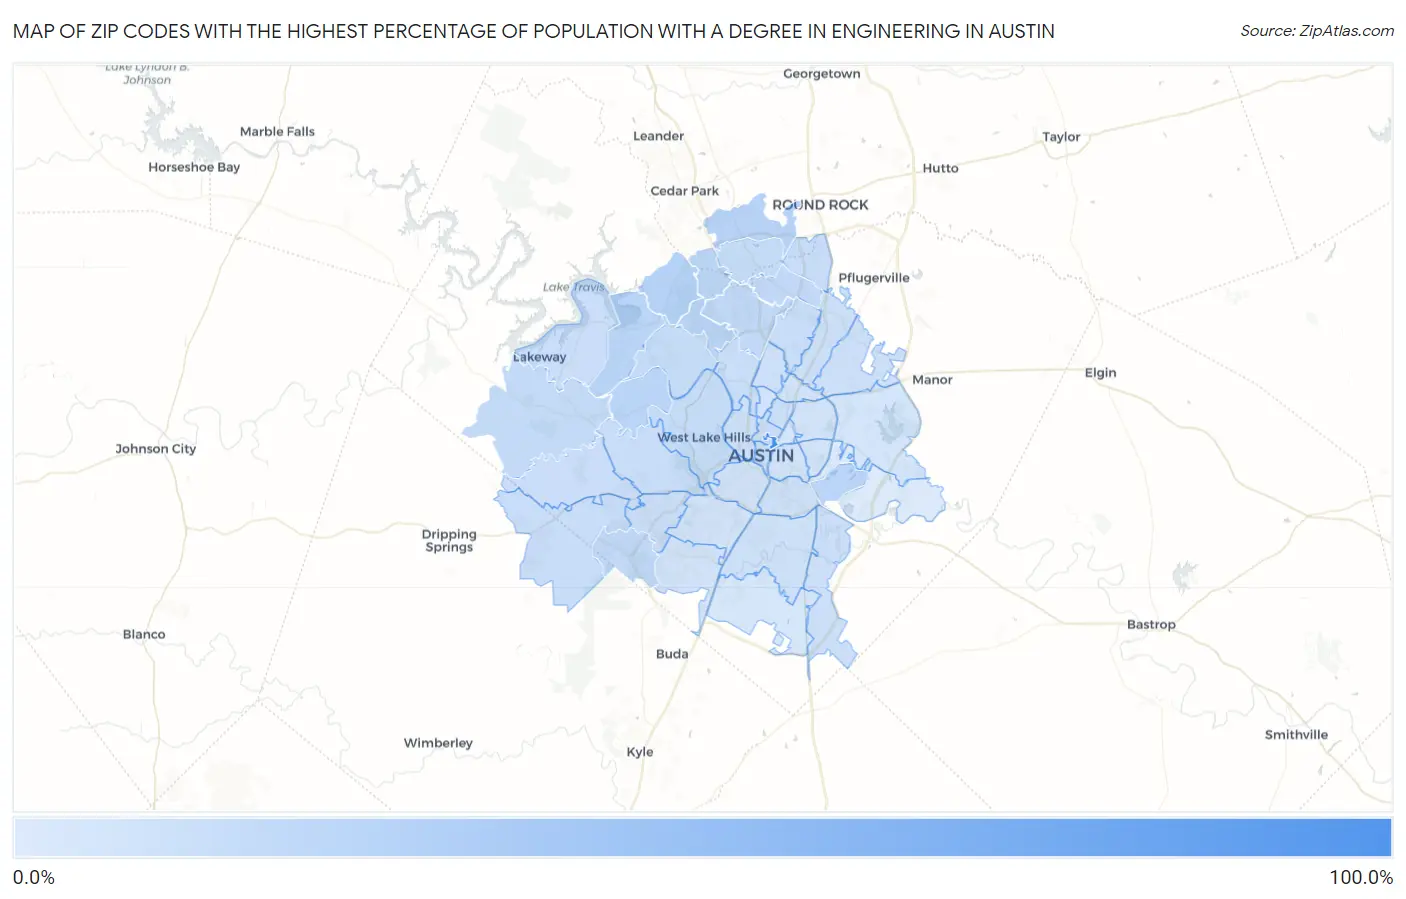
Map of Zip Codes with the Highest Percentage of Population with a Degree in Engineering in Austin
1.4%
100.0%
Zip Codes with the Highest Percentage of Population with a Degree in Engineering in Austin, TX
| Zip Code | % Graduates | vs State | vs National | |
| 1. | 78712 | 100.0% | 9.5%(+90.5)#3 | 7.6%(+92.4)#21 |
| 2. | 78726 | 21.1% | 9.5%(+11.5)#50 | 7.6%(+13.4)#808 |
| 3. | 78717 | 20.4% | 9.5%(+10.9)#57 | 7.6%(+12.8)#864 |
| 4. | 78732 | 18.2% | 9.5%(+8.67)#72 | 7.6%(+10.6)#1,131 |
| 5. | 78733 | 18.1% | 9.5%(+8.60)#74 | 7.6%(+10.5)#1,149 |
| 6. | 78742 | 18.1% | 9.5%(+8.52)#76 | 7.6%(+10.4)#1,157 |
| 7. | 78750 | 18.0% | 9.5%(+8.42)#77 | 7.6%(+10.3)#1,165 |
| 8. | 78759 | 15.5% | 9.5%(+6.01)#113 | 7.6%(+7.90)#1,596 |
| 9. | 78739 | 15.1% | 9.5%(+5.54)#129 | 7.6%(+7.43)#1,729 |
| 10. | 78727 | 14.9% | 9.5%(+5.32)#134 | 7.6%(+7.21)#1,780 |
| 11. | 78738 | 13.5% | 9.5%(+3.91)#183 | 7.6%(+5.81)#2,239 |
| 12. | 78729 | 13.1% | 9.5%(+3.54)#195 | 7.6%(+5.44)#2,375 |
| 13. | 78730 | 12.3% | 9.5%(+2.72)#226 | 7.6%(+4.61)#2,773 |
| 14. | 78746 | 12.1% | 9.5%(+2.56)#229 | 7.6%(+4.45)#2,847 |
| 15. | 78758 | 11.9% | 9.5%(+2.39)#236 | 7.6%(+4.28)#2,931 |
| 16. | 78728 | 11.8% | 9.5%(+2.25)#244 | 7.6%(+4.14)#3,003 |
| 17. | 78737 | 11.7% | 9.5%(+2.18)#247 | 7.6%(+4.07)#3,043 |
| 18. | 78701 | 11.6% | 9.5%(+2.03)#255 | 7.6%(+3.92)#3,128 |
| 19. | 78735 | 11.2% | 9.5%(+1.62)#273 | 7.6%(+3.52)#3,427 |
| 20. | 78731 | 10.9% | 9.5%(+1.38)#290 | 7.6%(+3.28)#3,603 |
| 21. | 78751 | 10.8% | 9.5%(+1.25)#298 | 7.6%(+3.14)#3,708 |
| 22. | 78734 | 10.6% | 9.5%(+1.10)#309 | 7.6%(+2.99)#3,832 |
| 23. | 78736 | 10.4% | 9.5%(+0.879)#325 | 7.6%(+2.77)#4,058 |
| 24. | 78749 | 10.4% | 9.5%(+0.868)#327 | 7.6%(+2.76)#4,067 |
| 25. | 78705 | 10.4% | 9.5%(+0.853)#329 | 7.6%(+2.75)#4,083 |
| 26. | 78757 | 9.6% | 9.5%(+0.059)#402 | 7.6%(+1.95)#4,868 |
| 27. | 78754 | 9.4% | 9.5%(-0.168)#422 | 7.6%(+1.72)#5,123 |
| 28. | 78719 | 9.2% | 9.5%(-0.374)#430 | 7.6%(+1.52)#5,358 |
| 29. | 78753 | 8.8% | 9.5%(-0.740)#455 | 7.6%(+1.15)#5,877 |
| 30. | 78703 | 8.2% | 9.5%(-1.33)#513 | 7.6%(+0.566)#6,725 |
| 31. | 78744 | 8.1% | 9.5%(-1.47)#525 | 7.6%(+0.424)#6,978 |
| 32. | 78741 | 7.7% | 9.5%(-1.86)#565 | 7.6%(+0.029)#7,690 |
| 33. | 78752 | 7.3% | 9.5%(-2.19)#600 | 7.6%(-0.299)#8,300 |
| 34. | 78702 | 7.2% | 9.5%(-2.34)#615 | 7.6%(-0.448)#8,577 |
| 35. | 78723 | 7.0% | 9.5%(-2.54)#643 | 7.6%(-0.644)#8,974 |
| 36. | 78748 | 6.5% | 9.5%(-3.08)#704 | 7.6%(-1.19)#10,095 |
| 37. | 78721 | 6.4% | 9.5%(-3.13)#716 | 7.6%(-1.23)#10,191 |
| 38. | 78745 | 6.4% | 9.5%(-3.14)#720 | 7.6%(-1.25)#10,237 |
| 39. | 78704 | 6.3% | 9.5%(-3.20)#726 | 7.6%(-1.31)#10,370 |
| 40. | 78724 | 6.1% | 9.5%(-3.44)#756 | 7.6%(-1.55)#10,949 |
| 41. | 78722 | 5.8% | 9.5%(-3.72)#799 | 7.6%(-1.83)#11,641 |
| 42. | 78756 | 5.3% | 9.5%(-4.27)#881 | 7.6%(-2.37)#13,011 |
| 43. | 78747 | 4.7% | 9.5%(-4.86)#966 | 7.6%(-2.96)#14,573 |
| 44. | 78725 | 1.4% | 9.5%(-8.13)#1,342 | 7.6%(-6.24)#21,983 |
1
Common Questions
What are the Top 10 Zip Codes with the Highest Percentage of Population with a Degree in Engineering in Austin, TX?
Top 10 Zip Codes with the Highest Percentage of Population with a Degree in Engineering in Austin, TX are:
What zip code has the Highest Percentage of Population with a Degree in Engineering in Austin, TX?
78712 has the Highest Percentage of Population with a Degree in Engineering in Austin, TX with 100.0%.
What is the Percentage of Population with a Degree in Engineering in Austin, TX?
Percentage of Population with a Degree in Engineering in Austin is 10.4%.
What is the Percentage of Population with a Degree in Engineering in Texas?
Percentage of Population with a Degree in Engineering in Texas is 9.5%.
What is the Percentage of Population with a Degree in Engineering in the United States?
Percentage of Population with a Degree in Engineering in the United States is 7.6%.