Gaffney, SC Map & Demographics
Gaffney Map
Gaffney Overview
$21,682
PER CAPITA INCOME
$51,333
AVG FAMILY INCOME
$38,059
AVG HOUSEHOLD INCOME
29.6%
WAGE / INCOME GAP [ % ]
70.4¢/ $1
WAGE / INCOME GAP [ $ ]
0.48
INEQUALITY / GINI INDEX
12,651
TOTAL POPULATION
6,081
MALE POPULATION
6,570
FEMALE POPULATION
92.56
MALES / 100 FEMALES
108.04
FEMALES / 100 MALES
33.6
MEDIAN AGE
3.5
AVG FAMILY SIZE
2.5
AVG HOUSEHOLD SIZE
5,504
LABOR FORCE [ PEOPLE ]
54.6%
PERCENT IN LABOR FORCE
9.4%
UNEMPLOYMENT RATE
Gaffney Area Codes
Income in Gaffney
Income Overview in Gaffney
Per Capita Income in Gaffney is $21,682, while median incomes of families and households are $51,333 and $38,059 respectively.
| Characteristic | Number | Measure |
| Per Capita Income | 12,651 | $21,682 |
| Median Family Income | 2,546 | $51,333 |
| Mean Family Income | 2,546 | $71,192 |
| Median Household Income | 4,611 | $38,059 |
| Mean Household Income | 4,611 | $53,835 |
| Income Deficit | 2,546 | $0 |
| Wage / Income Gap (%) | 12,651 | 29.65% |
| Wage / Income Gap ($) | 12,651 | 70.35¢ per $1 |
| Gini / Inequality Index | 12,651 | 0.48 |
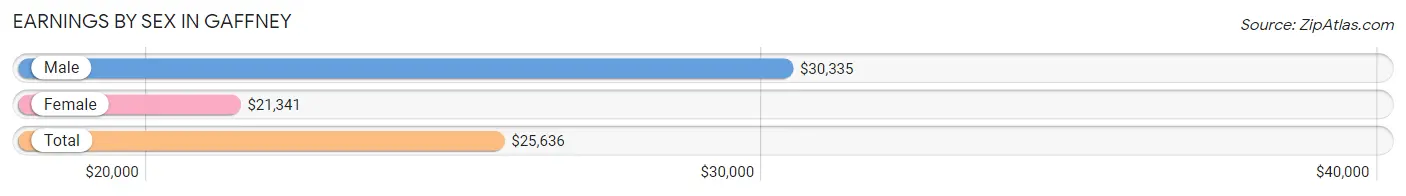
Earnings by Sex in Gaffney
Average Earnings in Gaffney are $25,636, $30,335 for men and $21,341 for women, a difference of 29.6%.
| Sex | Number | Average Earnings |
| Male | 2,909 (49.4%) | $30,335 |
| Female | 2,983 (50.6%) | $21,341 |
| Total | 5,892 (100.0%) | $25,636 |
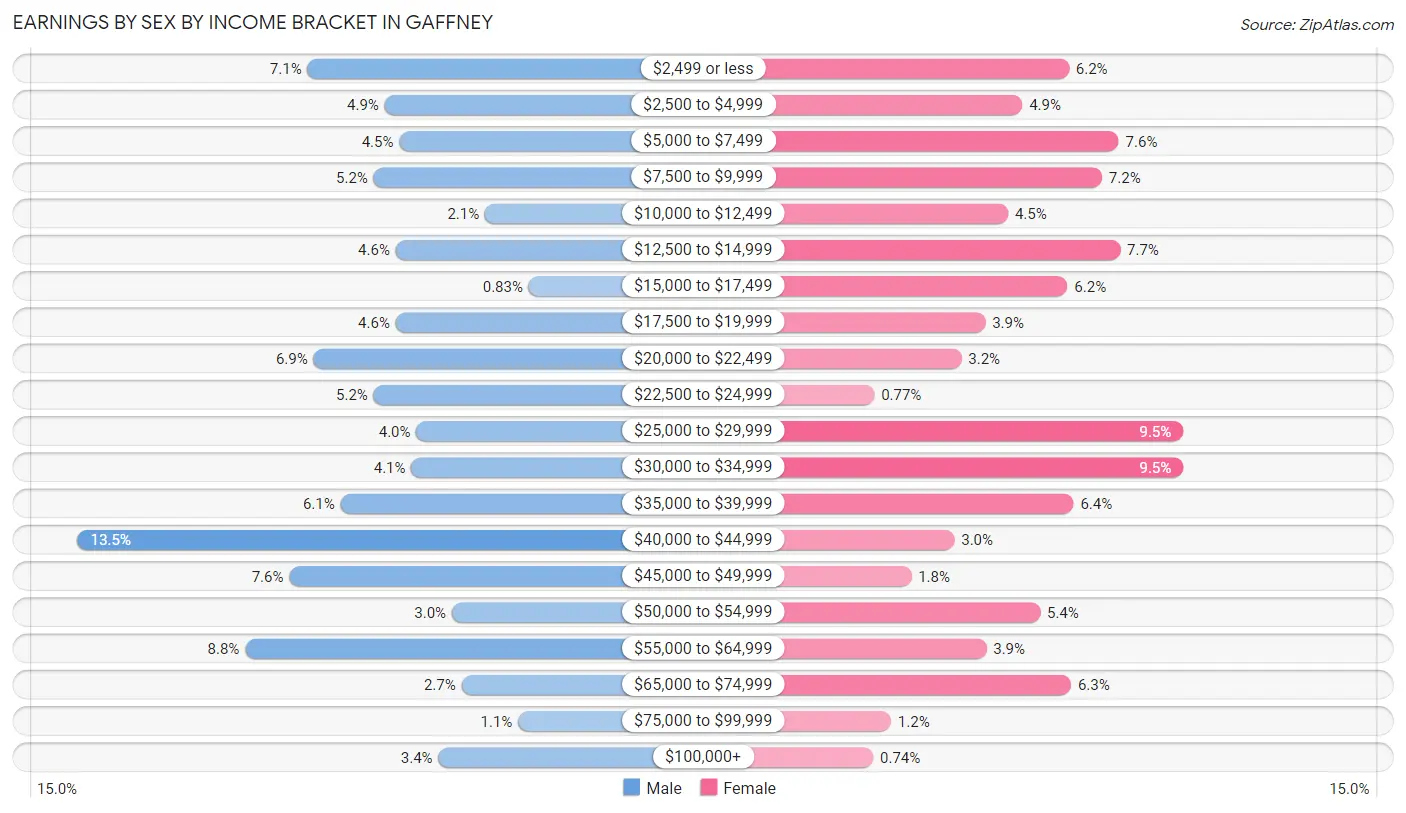
Earnings by Sex by Income Bracket in Gaffney
The most common earnings brackets in Gaffney are $40,000 to $44,999 for men (393 | 13.5%) and $25,000 to $29,999 for women (282 | 9.5%).
| Income | Male | Female |
| $2,499 or less | 205 (7.0%) | 186 (6.2%) |
| $2,500 to $4,999 | 142 (4.9%) | 147 (4.9%) |
| $5,000 to $7,499 | 130 (4.5%) | 228 (7.6%) |
| $7,500 to $9,999 | 151 (5.2%) | 214 (7.2%) |
| $10,000 to $12,499 | 60 (2.1%) | 135 (4.5%) |
| $12,500 to $14,999 | 133 (4.6%) | 229 (7.7%) |
| $15,000 to $17,499 | 24 (0.8%) | 185 (6.2%) |
| $17,500 to $19,999 | 133 (4.6%) | 116 (3.9%) |
| $20,000 to $22,499 | 200 (6.9%) | 96 (3.2%) |
| $22,500 to $24,999 | 151 (5.2%) | 23 (0.8%) |
| $25,000 to $29,999 | 116 (4.0%) | 282 (9.5%) |
| $30,000 to $34,999 | 120 (4.1%) | 282 (9.5%) |
| $35,000 to $39,999 | 178 (6.1%) | 190 (6.4%) |
| $40,000 to $44,999 | 393 (13.5%) | 90 (3.0%) |
| $45,000 to $49,999 | 220 (7.6%) | 54 (1.8%) |
| $50,000 to $54,999 | 87 (3.0%) | 162 (5.4%) |
| $55,000 to $64,999 | 256 (8.8%) | 117 (3.9%) |
| $65,000 to $74,999 | 79 (2.7%) | 188 (6.3%) |
| $75,000 to $99,999 | 33 (1.1%) | 37 (1.2%) |
| $100,000+ | 98 (3.4%) | 22 (0.7%) |
| Total | 2,909 (100.0%) | 2,983 (100.0%) |
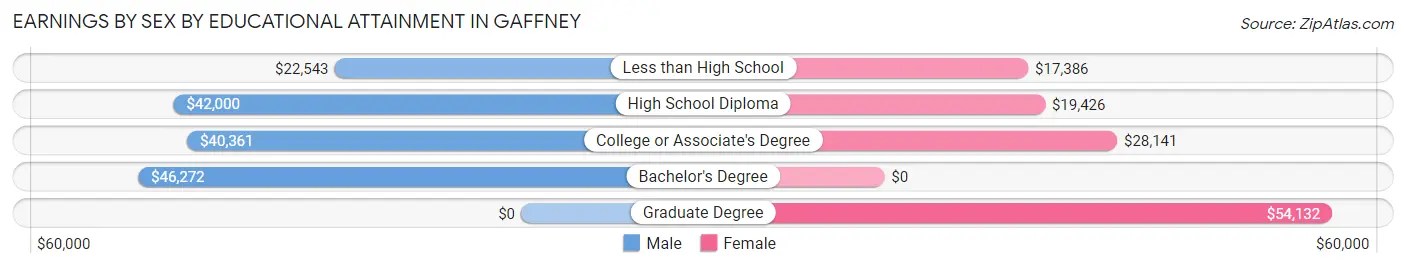
Earnings by Sex by Educational Attainment in Gaffney
Average earnings in Gaffney are $38,549 for men and $28,143 for women, a difference of 27.0%. Men with an educational attainment of bachelor's degree enjoy the highest average annual earnings of $46,272, while those with less than high school education earn the least with $22,543. Women with an educational attainment of graduate degree earn the most with the average annual earnings of $54,132, while those with less than high school education have the smallest earnings of $17,386.
| Educational Attainment | Male Income | Female Income |
| Less than High School | $22,543 | $17,386 |
| High School Diploma | $42,000 | $19,426 |
| College or Associate's Degree | $40,361 | $28,141 |
| Bachelor's Degree | $46,272 | $0 |
| Graduate Degree | - | - |
| Total | $38,549 | $28,143 |
Family Income in Gaffney
Family Income Brackets in Gaffney
According to the Gaffney family income data, there are 608 families falling into the $35,000 to $49,999 income range, which is the most common income bracket and makes up 23.9% of all families. Conversely, the $10,000 to $14,999 income bracket is the least frequent group with only 23 families (0.9%) belonging to this category.
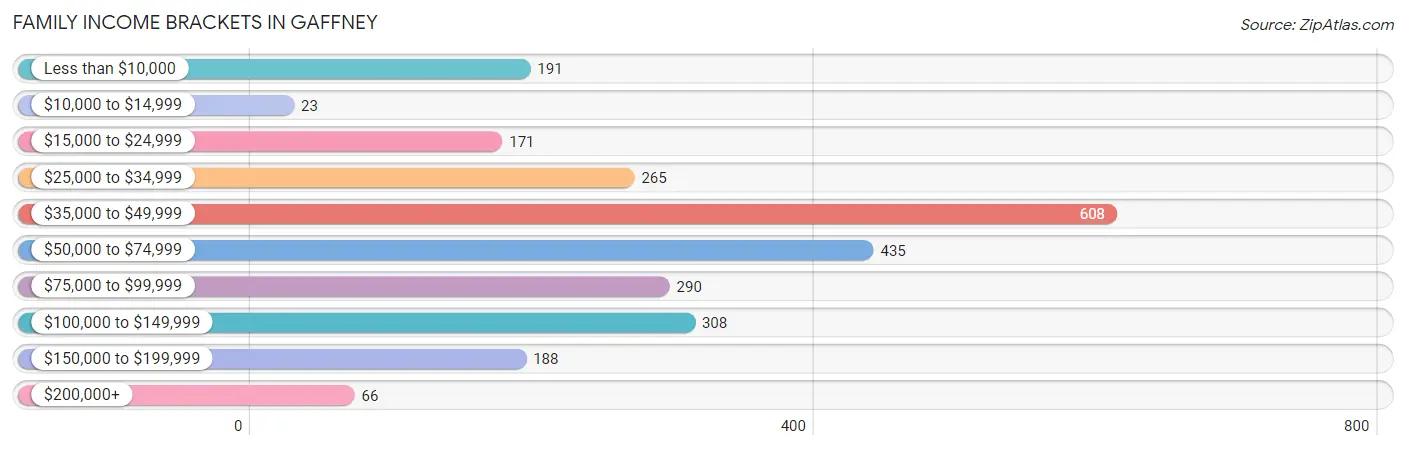
| Income Bracket | # Families | % Families |
| Less than $10,000 | 191 | 7.5% |
| $10,000 to $14,999 | 23 | 0.9% |
| $15,000 to $24,999 | 171 | 6.7% |
| $25,000 to $34,999 | 265 | 10.4% |
| $35,000 to $49,999 | 608 | 23.9% |
| $50,000 to $74,999 | 435 | 17.1% |
| $75,000 to $99,999 | 290 | 11.4% |
| $100,000 to $149,999 | 308 | 12.1% |
| $150,000 to $199,999 | 188 | 7.4% |
| $200,000+ | 66 | 2.6% |
Family Income by Famaliy Size in Gaffney
6-person families (63 | 2.5%) account for the highest median family income in Gaffney with $108,365 per family, while 2-person families (1,072 | 42.1%) have the highest median income of $25,000 per family member.
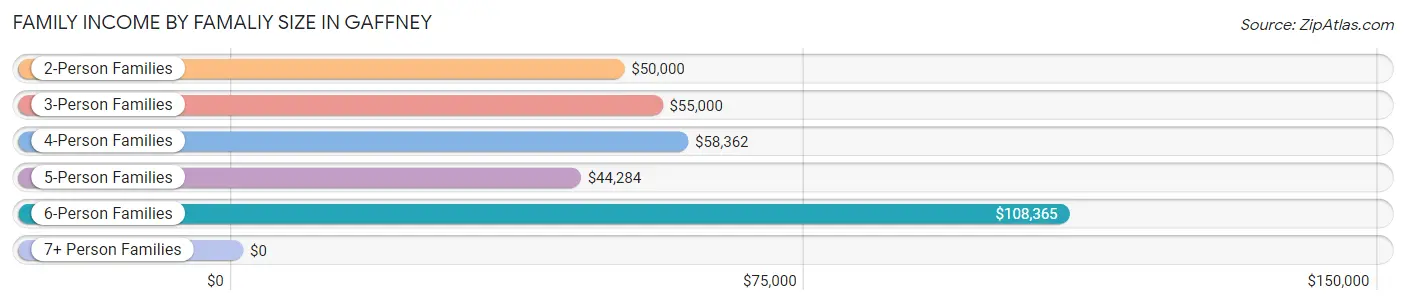
| Income Bracket | # Families | Median Income |
| 2-Person Families | 1,072 (42.1%) | $50,000 |
| 3-Person Families | 790 (31.0%) | $55,000 |
| 4-Person Families | 416 (16.3%) | $58,362 |
| 5-Person Families | 205 (8.1%) | $44,284 |
| 6-Person Families | 63 (2.5%) | $108,365 |
| 7+ Person Families | 0 (0.0%) | $0 |
| Total | 2,546 (100.0%) | $51,333 |
Family Income by Number of Earners in Gaffney
The median family income in Gaffney is $51,333, with families comprising 3+ earners (246) having the highest median family income of $135,357, while families with no earners (435) have the lowest median family income of $31,406, accounting for 9.7% and 17.1% of families, respectively.
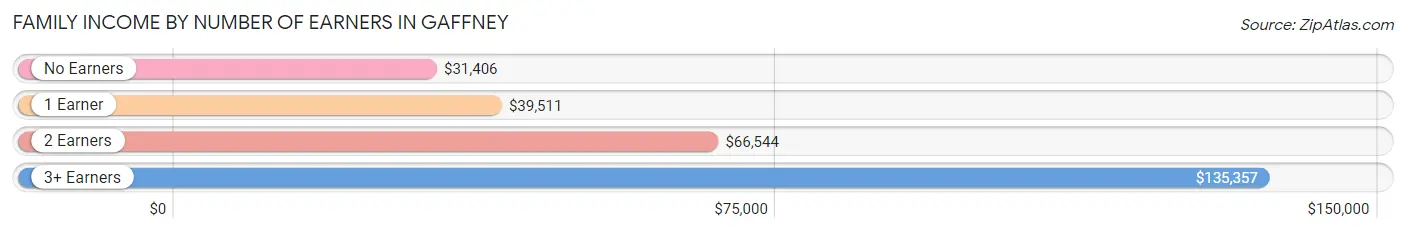
| Number of Earners | # Families | Median Income |
| No Earners | 435 (17.1%) | $31,406 |
| 1 Earner | 1,018 (40.0%) | $39,511 |
| 2 Earners | 847 (33.3%) | $66,544 |
| 3+ Earners | 246 (9.7%) | $135,357 |
| Total | 2,546 (100.0%) | $51,333 |
Household Income in Gaffney
Household Income Brackets in Gaffney
With 765 households falling in the category, the $35,000 to $49,999 income range is the most frequent in Gaffney, accounting for 16.6% of all households. In contrast, only 65 households (1.4%) fall into the $200,000+ income bracket, making it the least populous group.
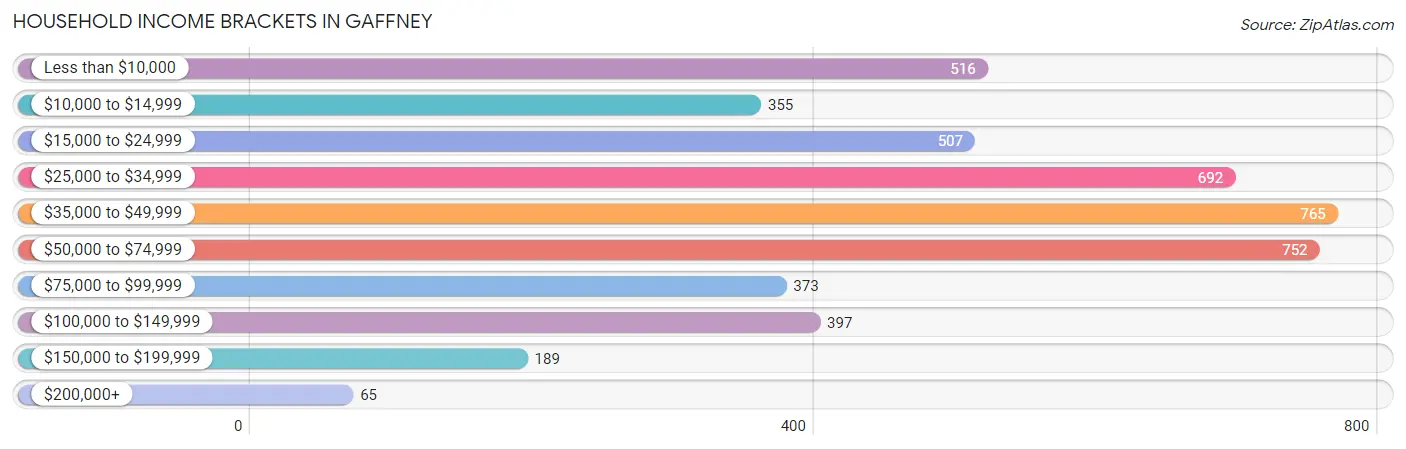
| Income Bracket | # Households | % Households |
| Less than $10,000 | 516 | 11.2% |
| $10,000 to $14,999 | 355 | 7.7% |
| $15,000 to $24,999 | 507 | 11.0% |
| $25,000 to $34,999 | 692 | 15.0% |
| $35,000 to $49,999 | 765 | 16.6% |
| $50,000 to $74,999 | 752 | 16.3% |
| $75,000 to $99,999 | 373 | 8.1% |
| $100,000 to $149,999 | 397 | 8.6% |
| $150,000 to $199,999 | 189 | 4.1% |
| $200,000+ | 65 | 1.4% |
Household Income by Householder Age in Gaffney
The median household income in Gaffney is $38,059, with the highest median household income of $52,730 found in the 15 to 24 years age bracket for the primary householder. A total of 152 households (3.3%) fall into this category. Meanwhile, the 65+ years age bracket for the primary householder has the lowest median household income of $32,565, with 1,287 households (27.9%) in this group.
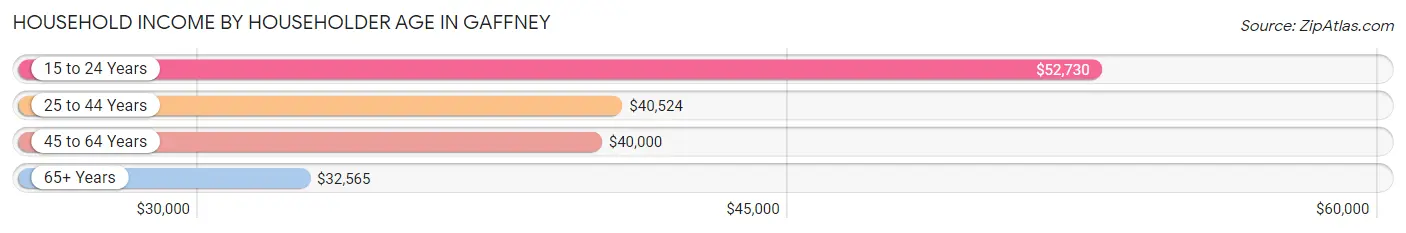
| Income Bracket | # Households | Median Income |
| 15 to 24 Years | 152 (3.3%) | $52,730 |
| 25 to 44 Years | 1,626 (35.3%) | $40,524 |
| 45 to 64 Years | 1,546 (33.5%) | $40,000 |
| 65+ Years | 1,287 (27.9%) | $32,565 |
| Total | 4,611 (100.0%) | $38,059 |
Poverty in Gaffney
Income Below Poverty by Sex and Age in Gaffney
With 20.0% poverty level for males and 26.0% for females among the residents of Gaffney, 12 to 14 year old males and 15 year old females are the most vulnerable to poverty, with 164 males (59.9%) and 61 females (47.3%) in their respective age groups living below the poverty level.
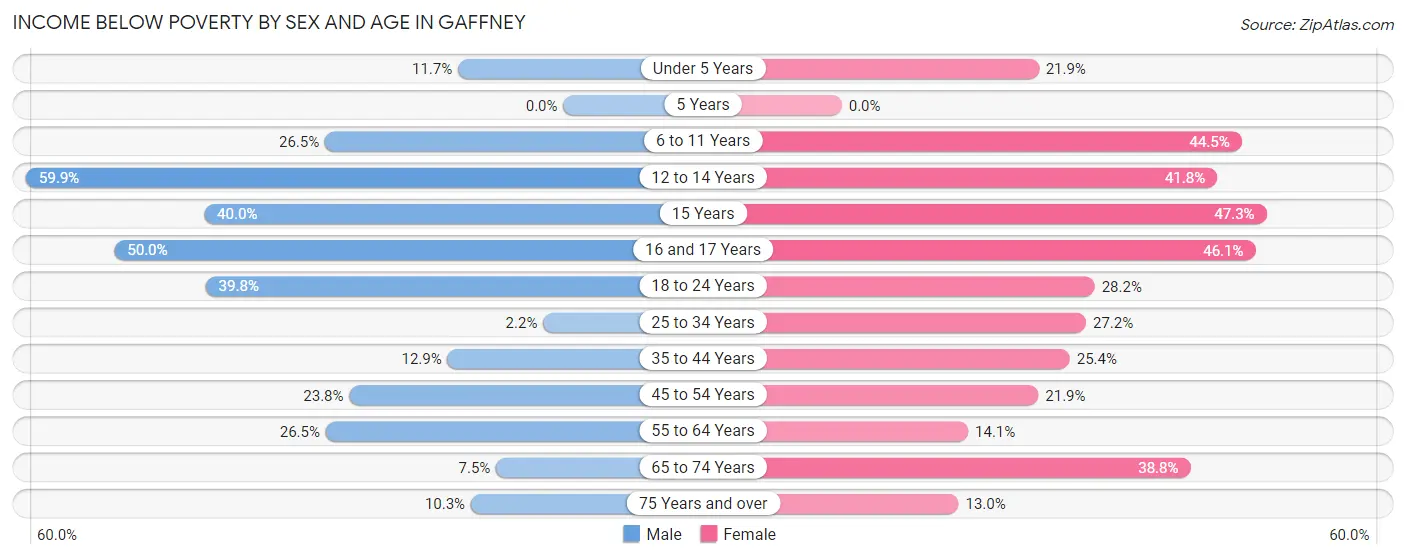
| Age Bracket | Male | Female |
| Under 5 Years | 59 (11.7%) | 91 (21.9%) |
| 5 Years | 0 (0.0%) | 0 (0.0%) |
| 6 to 11 Years | 82 (26.5%) | 195 (44.5%) |
| 12 to 14 Years | 164 (59.9%) | 61 (41.8%) |
| 15 Years | 26 (40.0%) | 61 (47.3%) |
| 16 and 17 Years | 28 (50.0%) | 35 (46.1%) |
| 18 to 24 Years | 335 (39.8%) | 129 (28.2%) |
| 25 to 34 Years | 22 (2.2%) | 272 (27.2%) |
| 35 to 44 Years | 93 (12.9%) | 162 (25.4%) |
| 45 to 54 Years | 112 (23.8%) | 192 (21.9%) |
| 55 to 64 Years | 145 (26.5%) | 102 (14.1%) |
| 65 to 74 Years | 40 (7.5%) | 203 (38.8%) |
| 75 Years and over | 32 (10.3%) | 58 (13.0%) |
| Total | 1,138 (20.0%) | 1,561 (26.0%) |
Income Above Poverty by Sex and Age in Gaffney
According to the poverty statistics in Gaffney, males aged 5 years and females aged 5 years are the age groups that are most secure financially, with 100.0% of males and 100.0% of females in these age groups living above the poverty line.
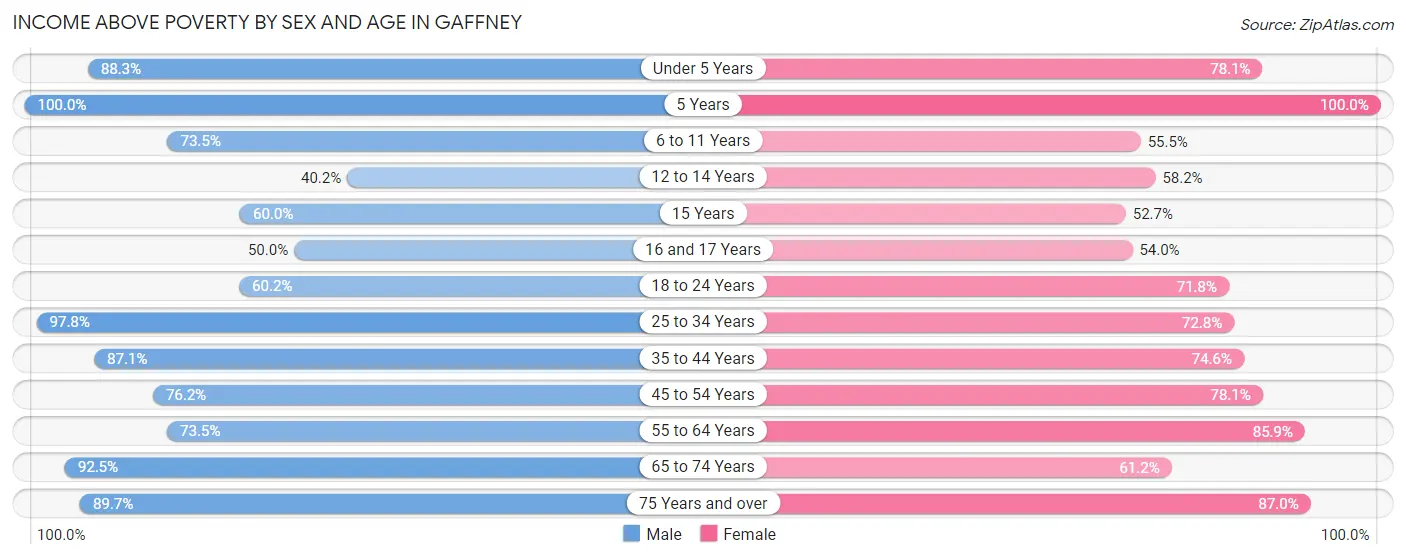
| Age Bracket | Male | Female |
| Under 5 Years | 444 (88.3%) | 324 (78.1%) |
| 5 Years | 81 (100.0%) | 136 (100.0%) |
| 6 to 11 Years | 227 (73.5%) | 243 (55.5%) |
| 12 to 14 Years | 110 (40.2%) | 85 (58.2%) |
| 15 Years | 39 (60.0%) | 68 (52.7%) |
| 16 and 17 Years | 28 (50.0%) | 41 (53.9%) |
| 18 to 24 Years | 506 (60.2%) | 329 (71.8%) |
| 25 to 34 Years | 958 (97.8%) | 728 (72.8%) |
| 35 to 44 Years | 628 (87.1%) | 476 (74.6%) |
| 45 to 54 Years | 358 (76.2%) | 685 (78.1%) |
| 55 to 64 Years | 403 (73.5%) | 623 (85.9%) |
| 65 to 74 Years | 495 (92.5%) | 320 (61.2%) |
| 75 Years and over | 279 (89.7%) | 388 (87.0%) |
| Total | 4,556 (80.0%) | 4,446 (74.0%) |
Income Below Poverty Among Married-Couple Families in Gaffney
The poverty statistics for married-couple families in Gaffney show that 2.2% or 33 of the total 1,464 families live below the poverty line. Families with 1 or 2 children have the highest poverty rate of 4.2%, comprising of 20 families. On the other hand, families with 3 or 4 children have the lowest poverty rate of 0.0%, which includes 0 families.
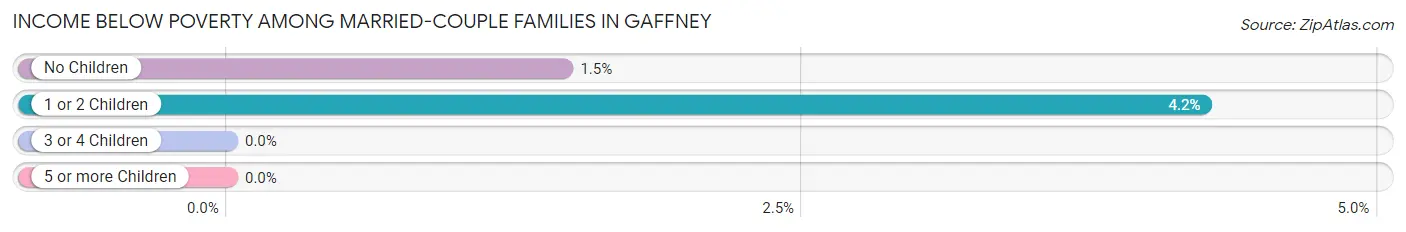
| Children | Above Poverty | Below Poverty |
| No Children | 875 (98.5%) | 13 (1.5%) |
| 1 or 2 Children | 452 (95.8%) | 20 (4.2%) |
| 3 or 4 Children | 104 (100.0%) | 0 (0.0%) |
| 5 or more Children | 0 (0.0%) | 0 (0.0%) |
| Total | 1,431 (97.8%) | 33 (2.2%) |
Income Below Poverty Among Single-Parent Households in Gaffney
According to the poverty data in Gaffney, 32.9% or 81 single-father households and 36.0% or 301 single-mother households are living below the poverty line. Among single-father households, those with 1 or 2 children have the highest poverty rate, with 63 households (87.5%) experiencing poverty. Likewise, among single-mother households, those with 1 or 2 children have the highest poverty rate, with 215 households (50.9%) falling below the poverty line.
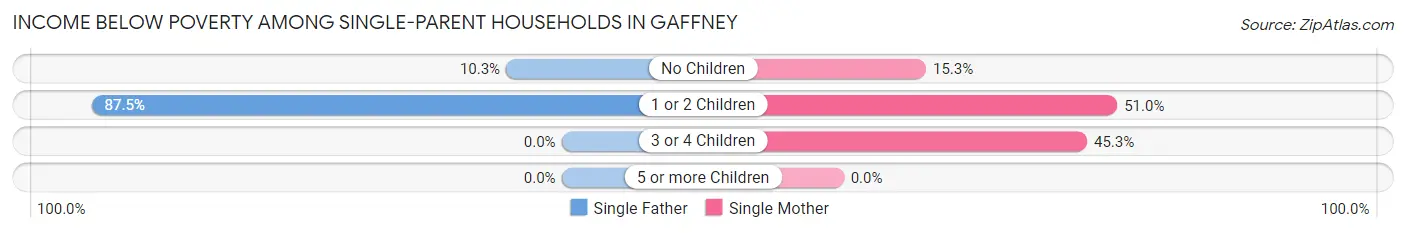
| Children | Single Father | Single Mother |
| No Children | 18 (10.3%) | 52 (15.3%) |
| 1 or 2 Children | 63 (87.5%) | 215 (50.9%) |
| 3 or 4 Children | 0 (0.0%) | 34 (45.3%) |
| 5 or more Children | 0 (0.0%) | 0 (0.0%) |
| Total | 81 (32.9%) | 301 (36.0%) |
Income Below Poverty Among Married-Couple vs Single-Parent Households in Gaffney
The poverty data for Gaffney shows that 33 of the married-couple family households (2.2%) and 382 of the single-parent households (35.3%) are living below the poverty level. Within the married-couple family households, those with 1 or 2 children have the highest poverty rate, with 20 households (4.2%) falling below the poverty line. Among the single-parent households, those with 1 or 2 children have the highest poverty rate, with 278 household (56.3%) living below poverty.
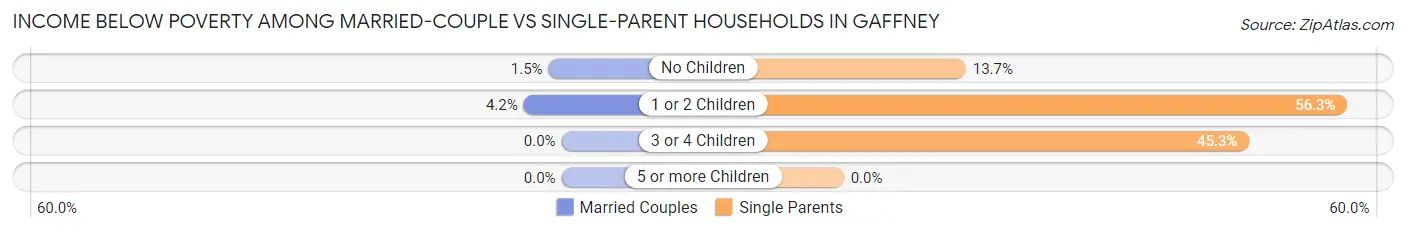
| Children | Married-Couple Families | Single-Parent Households |
| No Children | 13 (1.5%) | 70 (13.7%) |
| 1 or 2 Children | 20 (4.2%) | 278 (56.3%) |
| 3 or 4 Children | 0 (0.0%) | 34 (45.3%) |
| 5 or more Children | 0 (0.0%) | 0 (0.0%) |
| Total | 33 (2.2%) | 382 (35.3%) |
Race in Gaffney
The most populous races in Gaffney are Black / African American (5,496 | 43.4%), White / Caucasian (5,336 | 42.2%), and Two or more Races (1,074 | 8.5%).
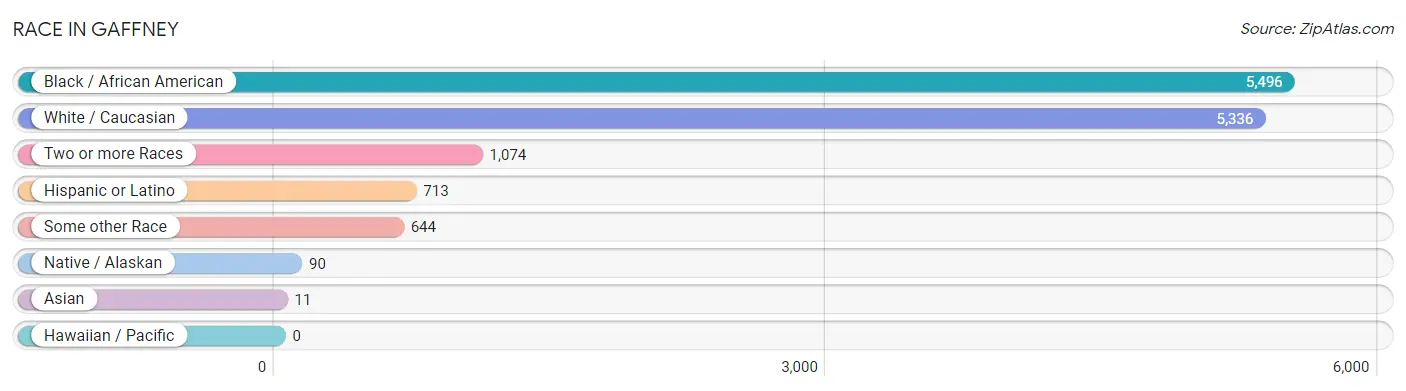
| Race | # Population | % Population |
| Asian | 11 | 0.1% |
| Black / African American | 5,496 | 43.4% |
| Hawaiian / Pacific | 0 | 0.0% |
| Hispanic or Latino | 713 | 5.6% |
| Native / Alaskan | 90 | 0.7% |
| White / Caucasian | 5,336 | 42.2% |
| Two or more Races | 1,074 | 8.5% |
| Some other Race | 644 | 5.1% |
| Total | 12,651 | 100.0% |
Ancestry in Gaffney
The most populous ancestries reported in Gaffney are American (1,206 | 9.5%), English (662 | 5.2%), Irish (460 | 3.6%), German (399 | 3.2%), and Mexican (383 | 3.0%), together accounting for 24.6% of all Gaffney residents.
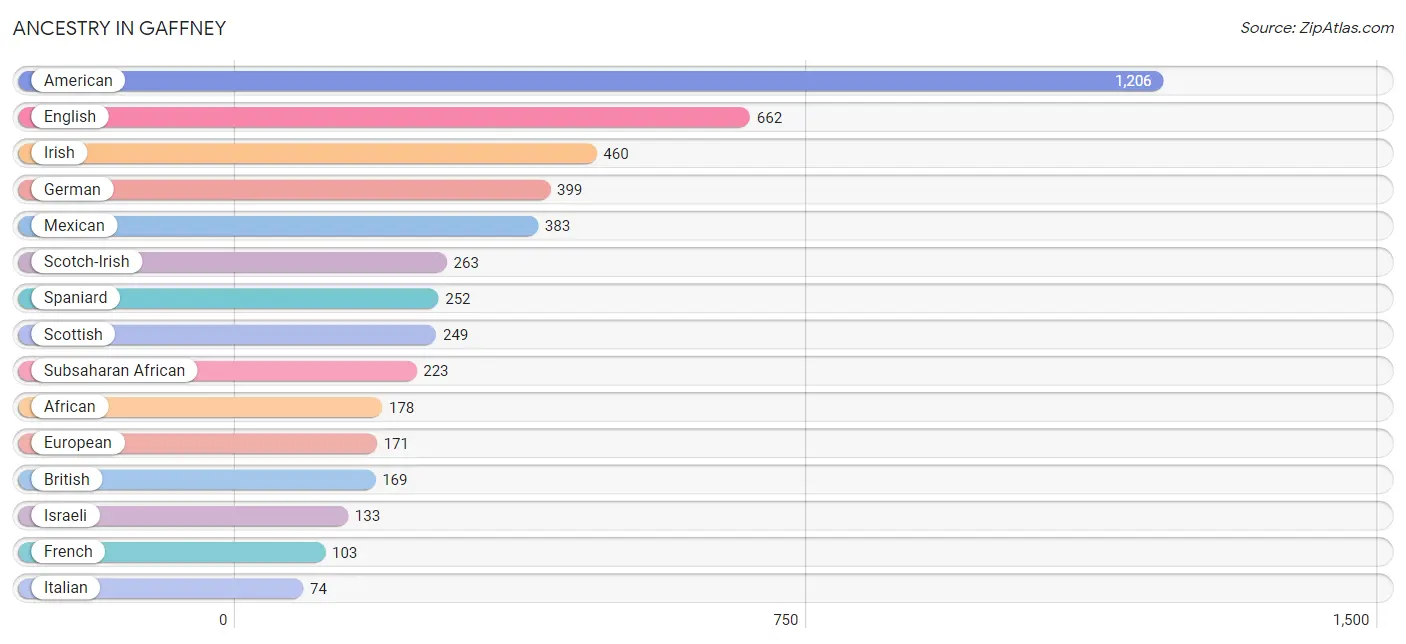
| Ancestry | # Population | % Population |
| African | 178 | 1.4% |
| American | 1,206 | 9.5% |
| Austrian | 35 | 0.3% |
| Barbadian | 2 | 0.0% |
| Blackfeet | 11 | 0.1% |
| Brazilian | 46 | 0.4% |
| British | 169 | 1.3% |
| Burmese | 31 | 0.3% |
| Central American | 12 | 0.1% |
| Cherokee | 11 | 0.1% |
| Chippewa | 13 | 0.1% |
| Croatian | 24 | 0.2% |
| Cuban | 7 | 0.1% |
| Czech | 16 | 0.1% |
| Dominican | 2 | 0.0% |
| Dutch | 20 | 0.2% |
| English | 662 | 5.2% |
| European | 171 | 1.3% |
| French | 103 | 0.8% |
| German | 399 | 3.2% |
| Greek | 27 | 0.2% |
| Honduran | 12 | 0.1% |
| Hungarian | 7 | 0.1% |
| Irish | 460 | 3.6% |
| Iroquois | 22 | 0.2% |
| Israeli | 133 | 1.1% |
| Italian | 74 | 0.6% |
| Japanese | 4 | 0.0% |
| Mexican | 383 | 3.0% |
| Polish | 39 | 0.3% |
| Portuguese | 32 | 0.3% |
| Puerto Rican | 57 | 0.4% |
| Russian | 15 | 0.1% |
| Scandinavian | 13 | 0.1% |
| Scotch-Irish | 263 | 2.1% |
| Scottish | 249 | 2.0% |
| South African | 26 | 0.2% |
| Spaniard | 252 | 2.0% |
| Subsaharan African | 223 | 1.8% |
| Swedish | 2 | 0.0% |
| Ute | 3 | 0.0% |
| Welsh | 29 | 0.2% | View All 42 Rows |
Immigrants in Gaffney
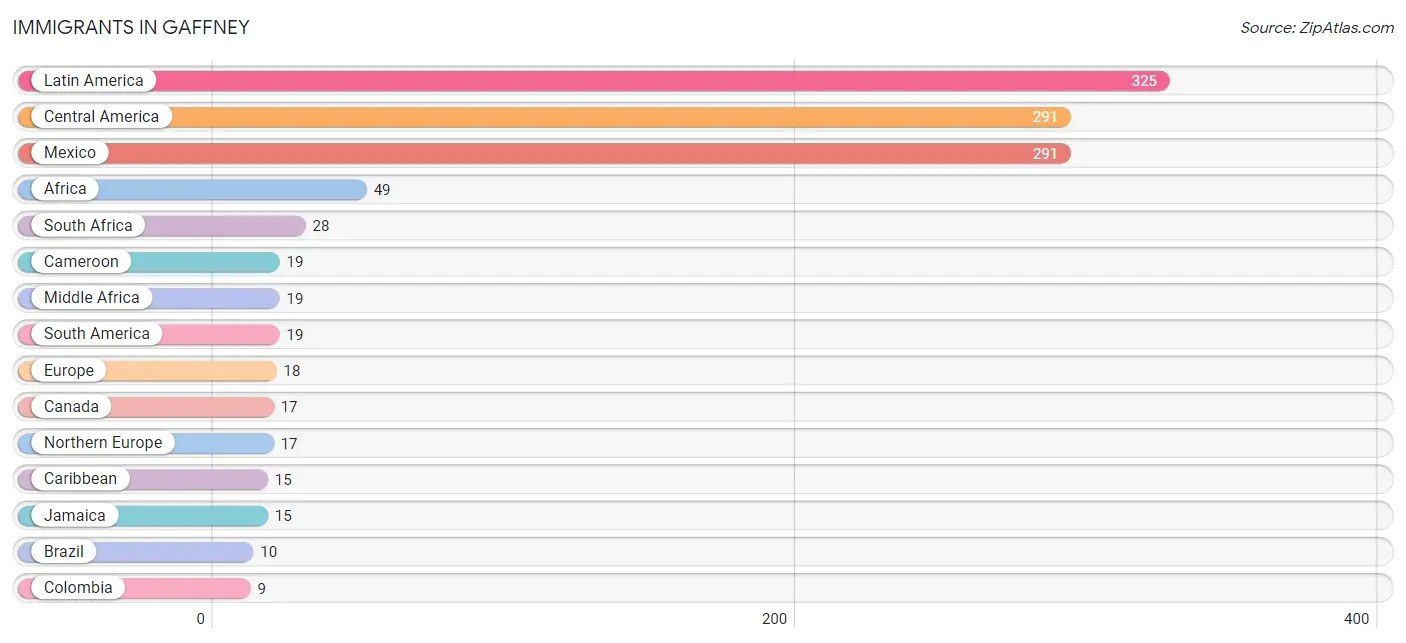
The most numerous immigrant groups reported in Gaffney came from Latin America (325 | 2.6%), Central America (291 | 2.3%), Mexico (291 | 2.3%), Africa (49 | 0.4%), and South Africa (28 | 0.2%), together accounting for 7.8% of all Gaffney residents.
| Immigration Origin | # Population | % Population |
| Africa | 49 | 0.4% |
| Asia | 4 | 0.0% |
| Brazil | 10 | 0.1% |
| Cameroon | 19 | 0.2% |
| Canada | 17 | 0.1% |
| Caribbean | 15 | 0.1% |
| Central America | 291 | 2.3% |
| Colombia | 9 | 0.1% |
| England | 3 | 0.0% |
| Europe | 18 | 0.1% |
| Jamaica | 15 | 0.1% |
| Latin America | 325 | 2.6% |
| Mexico | 291 | 2.3% |
| Middle Africa | 19 | 0.2% |
| Northern Europe | 17 | 0.1% |
| South Africa | 28 | 0.2% |
| South America | 19 | 0.2% |
| South Eastern Asia | 4 | 0.0% |
| Southern Europe | 1 | 0.0% |
| Spain | 1 | 0.0% |
| Sweden | 2 | 0.0% |
| Thailand | 4 | 0.0% | View All 22 Rows |
Sex and Age in Gaffney
Sex and Age in Gaffney
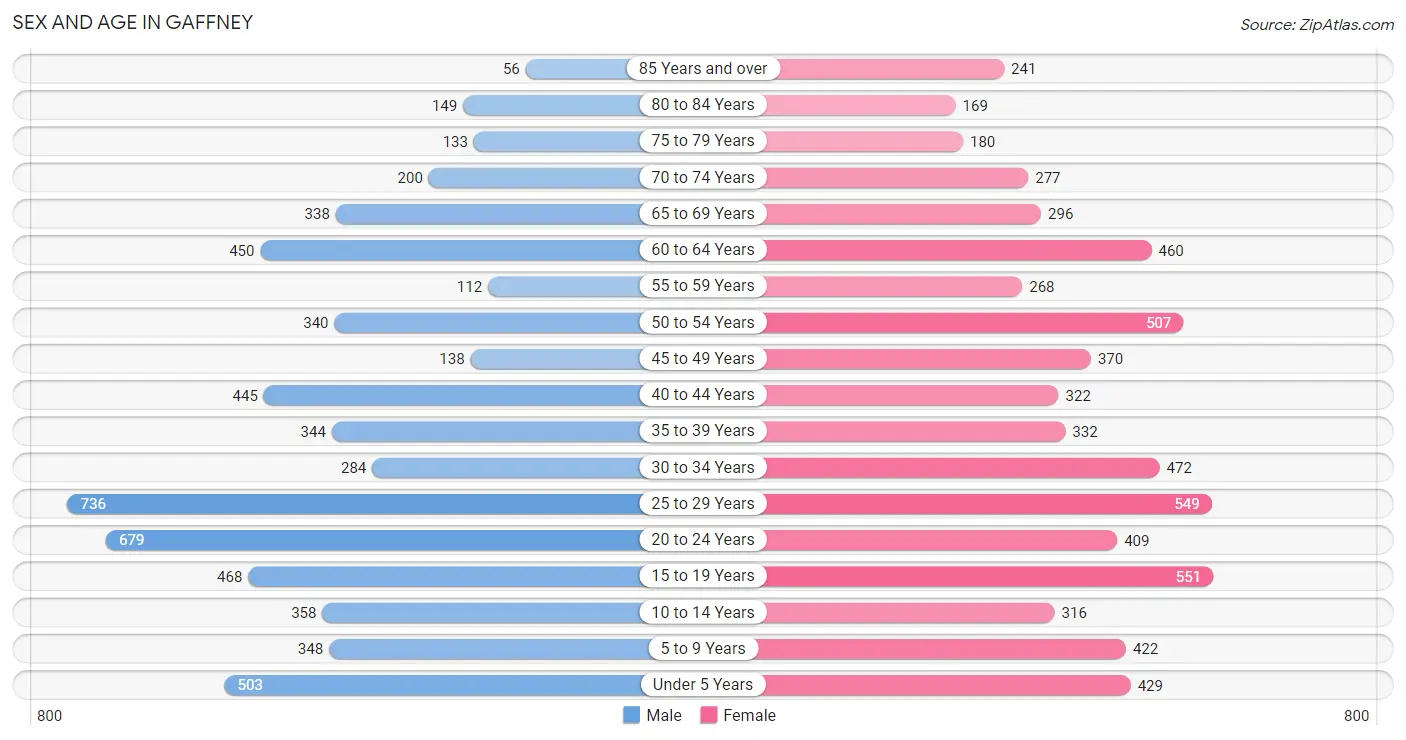
The most populous age groups in Gaffney are 25 to 29 Years (736 | 12.1%) for men and 15 to 19 Years (551 | 8.4%) for women.
| Age Bracket | Male | Female |
| Under 5 Years | 503 (8.3%) | 429 (6.5%) |
| 5 to 9 Years | 348 (5.7%) | 422 (6.4%) |
| 10 to 14 Years | 358 (5.9%) | 316 (4.8%) |
| 15 to 19 Years | 468 (7.7%) | 551 (8.4%) |
| 20 to 24 Years | 679 (11.2%) | 409 (6.2%) |
| 25 to 29 Years | 736 (12.1%) | 549 (8.4%) |
| 30 to 34 Years | 284 (4.7%) | 472 (7.2%) |
| 35 to 39 Years | 344 (5.7%) | 332 (5.1%) |
| 40 to 44 Years | 445 (7.3%) | 322 (4.9%) |
| 45 to 49 Years | 138 (2.3%) | 370 (5.6%) |
| 50 to 54 Years | 340 (5.6%) | 507 (7.7%) |
| 55 to 59 Years | 112 (1.8%) | 268 (4.1%) |
| 60 to 64 Years | 450 (7.4%) | 460 (7.0%) |
| 65 to 69 Years | 338 (5.6%) | 296 (4.5%) |
| 70 to 74 Years | 200 (3.3%) | 277 (4.2%) |
| 75 to 79 Years | 133 (2.2%) | 180 (2.7%) |
| 80 to 84 Years | 149 (2.5%) | 169 (2.6%) |
| 85 Years and over | 56 (0.9%) | 241 (3.7%) |
| Total | 6,081 (100.0%) | 6,570 (100.0%) |
Families and Households in Gaffney
Median Family Size in Gaffney
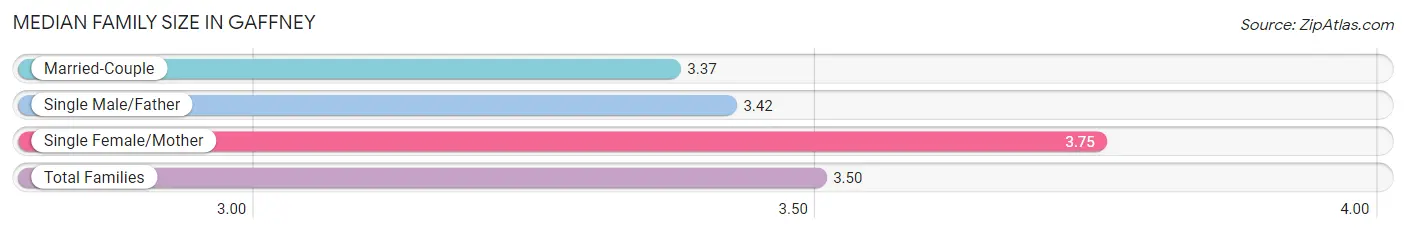
The median family size in Gaffney is 3.50 persons per family, with single female/mother families (836 | 32.8%) accounting for the largest median family size of 3.75 persons per family. On the other hand, married-couple families (1,464 | 57.5%) represent the smallest median family size with 3.37 persons per family.
| Family Type | # Families | Family Size |
| Married-Couple | 1,464 (57.5%) | 3.37 |
| Single Male/Father | 246 (9.7%) | 3.42 |
| Single Female/Mother | 836 (32.8%) | 3.75 |
| Total Families | 2,546 (100.0%) | 3.50 |
Median Household Size in Gaffney
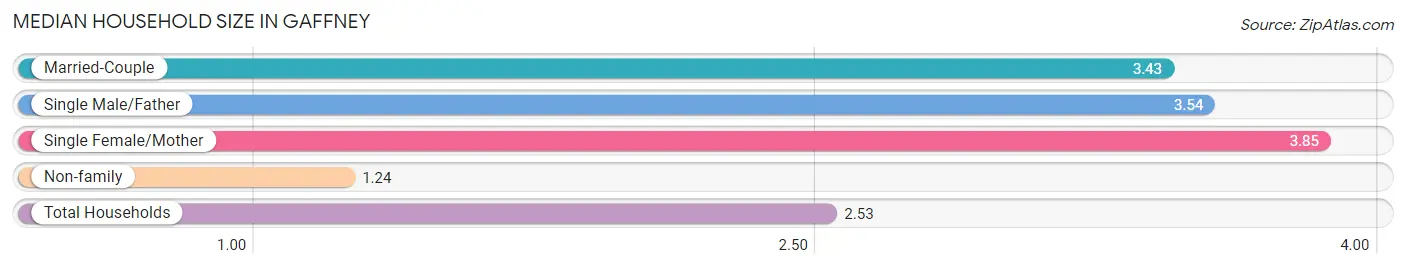
The median household size in Gaffney is 2.53 persons per household, with single female/mother households (836 | 18.1%) accounting for the largest median household size of 3.85 persons per household. non-family households (2,065 | 44.8%) represent the smallest median household size with 1.24 persons per household.
| Household Type | # Households | Household Size |
| Married-Couple | 1,464 (31.8%) | 3.43 |
| Single Male/Father | 246 (5.3%) | 3.54 |
| Single Female/Mother | 836 (18.1%) | 3.85 |
| Non-family | 2,065 (44.8%) | 1.24 |
| Total Households | 4,611 (100.0%) | 2.53 |
Household Size by Marriage Status in Gaffney
Out of a total of 4,611 households in Gaffney, 2,546 (55.2%) are family households, while 2,065 (44.8%) are nonfamily households. The most numerous type of family households are 2-person households, comprising 1,050, and the most common type of nonfamily households are 1-person households, comprising 1,810.
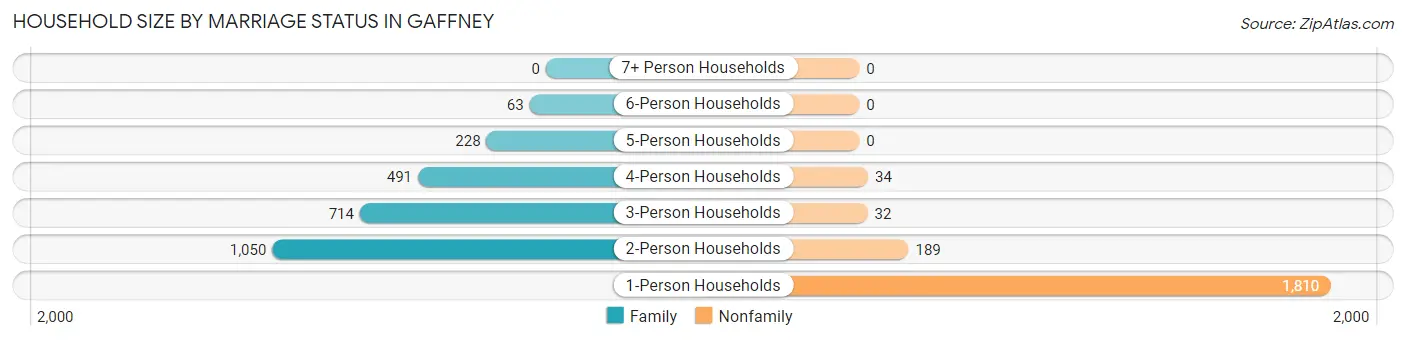
| Household Size | Family Households | Nonfamily Households |
| 1-Person Households | - | 1,810 (39.3%) |
| 2-Person Households | 1,050 (22.8%) | 189 (4.1%) |
| 3-Person Households | 714 (15.5%) | 32 (0.7%) |
| 4-Person Households | 491 (10.6%) | 34 (0.7%) |
| 5-Person Households | 228 (4.9%) | 0 (0.0%) |
| 6-Person Households | 63 (1.4%) | 0 (0.0%) |
| 7+ Person Households | 0 (0.0%) | 0 (0.0%) |
| Total | 2,546 (55.2%) | 2,065 (44.8%) |
Female Fertility in Gaffney
Fertility by Age in Gaffney
Average fertility rate in Gaffney is 49.0 births per 1,000 women. Women in the age bracket of 20 to 34 years have the highest fertility rate with 96.0 births per 1,000 women. Women in the age bracket of 20 to 34 years acount for 91.3% of all women with births.
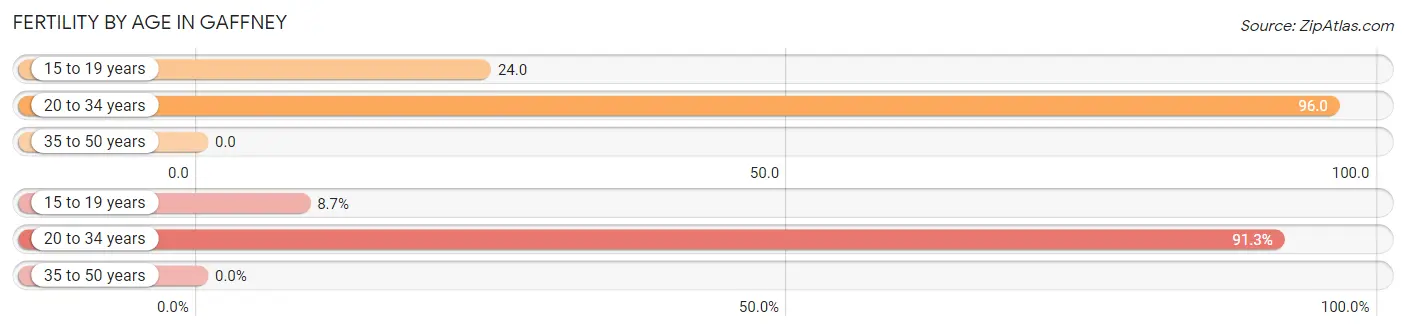
| Age Bracket | Women with Births | Births / 1,000 Women |
| 15 to 19 years | 13 (8.7%) | 24.0 |
| 20 to 34 years | 137 (91.3%) | 96.0 |
| 35 to 50 years | 0 (0.0%) | 0.0 |
| Total | 150 (100.0%) | 49.0 |
Fertility by Age by Marriage Status in Gaffney
34.7% of women with births (150) in Gaffney are married. The highest percentage of unmarried women with births falls into 15 to 19 years age bracket with 100.0% of them unmarried at the time of birth, while the lowest percentage of unmarried women with births belong to 20 to 34 years age bracket with 62.0% of them unmarried.
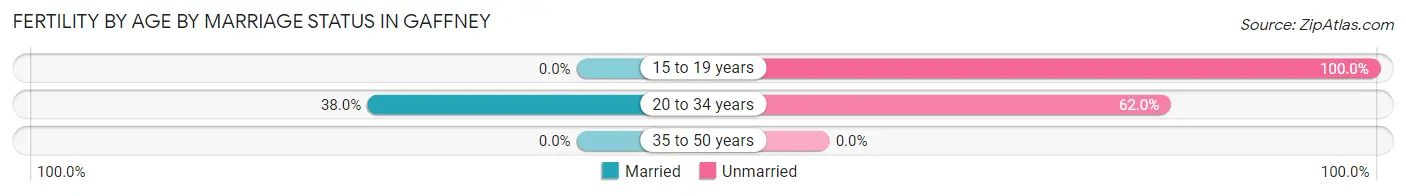
| Age Bracket | Married | Unmarried |
| 15 to 19 years | 0 (0.0%) | 13 (100.0%) |
| 20 to 34 years | 52 (38.0%) | 85 (62.0%) |
| 35 to 50 years | 0 (0.0%) | 0 (0.0%) |
| Total | 52 (34.7%) | 98 (65.3%) |
Fertility by Education in Gaffney
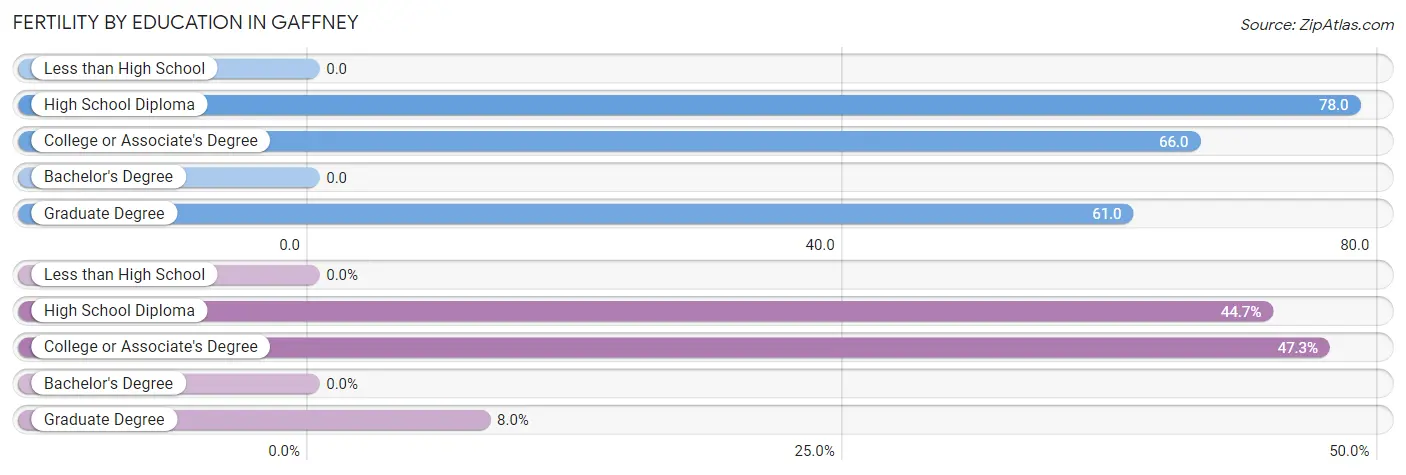
| Educational Attainment | Women with Births | Births / 1,000 Women |
| Less than High School | 0 (0.0%) | 0.0 |
| High School Diploma | 67 (44.7%) | 78.0 |
| College or Associate's Degree | 71 (47.3%) | 66.0 |
| Bachelor's Degree | 0 (0.0%) | 0.0 |
| Graduate Degree | 12 (8.0%) | 61.0 |
| Total | 150 (100.0%) | 49.0 |
Fertility by Education by Marriage Status in Gaffney
65.3% of women with births in Gaffney are unmarried. Women with the educational attainment of graduate degree are most likely to be married with 100.0% of them married at childbirth, while women with the educational attainment of college or associate's degree are least likely to be married with 84.5% of them unmarried at childbirth.
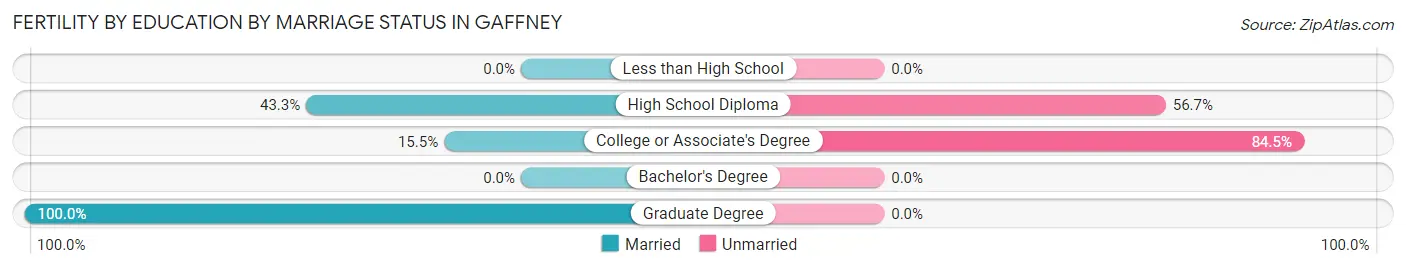
| Educational Attainment | Married | Unmarried |
| Less than High School | 0 (0.0%) | 0 (0.0%) |
| High School Diploma | 29 (43.3%) | 38 (56.7%) |
| College or Associate's Degree | 11 (15.5%) | 60 (84.5%) |
| Bachelor's Degree | 0 (0.0%) | 0 (0.0%) |
| Graduate Degree | 12 (100.0%) | 0 (0.0%) |
| Total | 52 (34.7%) | 98 (65.3%) |
Employment Characteristics in Gaffney
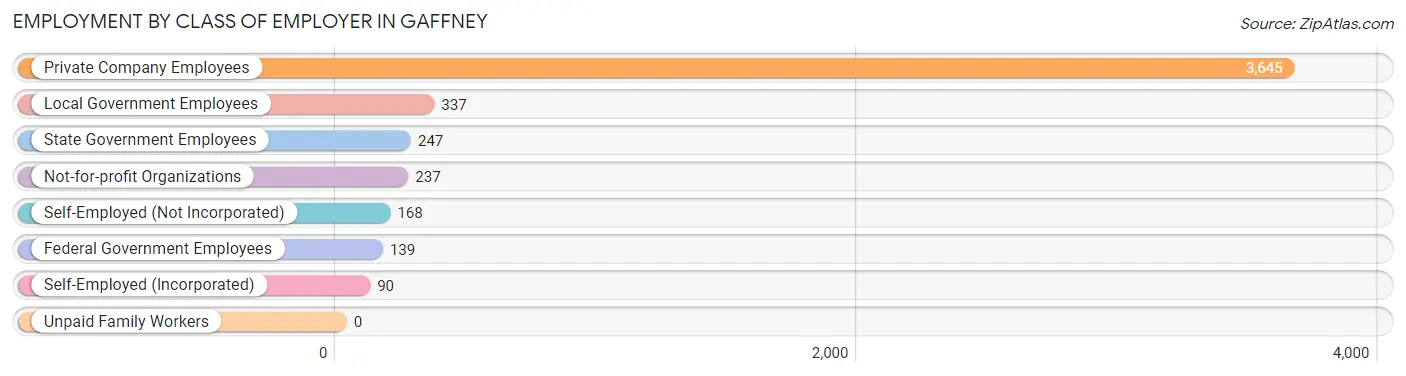
Employment by Class of Employer in Gaffney
Among the 4,863 employed individuals in Gaffney, private company employees (3,645 | 75.0%), local government employees (337 | 6.9%), and state government employees (247 | 5.1%) make up the most common classes of employment.
| Employer Class | # Employees | % Employees |
| Private Company Employees | 3,645 | 75.0% |
| Self-Employed (Incorporated) | 90 | 1.8% |
| Self-Employed (Not Incorporated) | 168 | 3.5% |
| Not-for-profit Organizations | 237 | 4.9% |
| Local Government Employees | 337 | 6.9% |
| State Government Employees | 247 | 5.1% |
| Federal Government Employees | 139 | 2.9% |
| Unpaid Family Workers | 0 | 0.0% |
| Total | 4,863 | 100.0% |
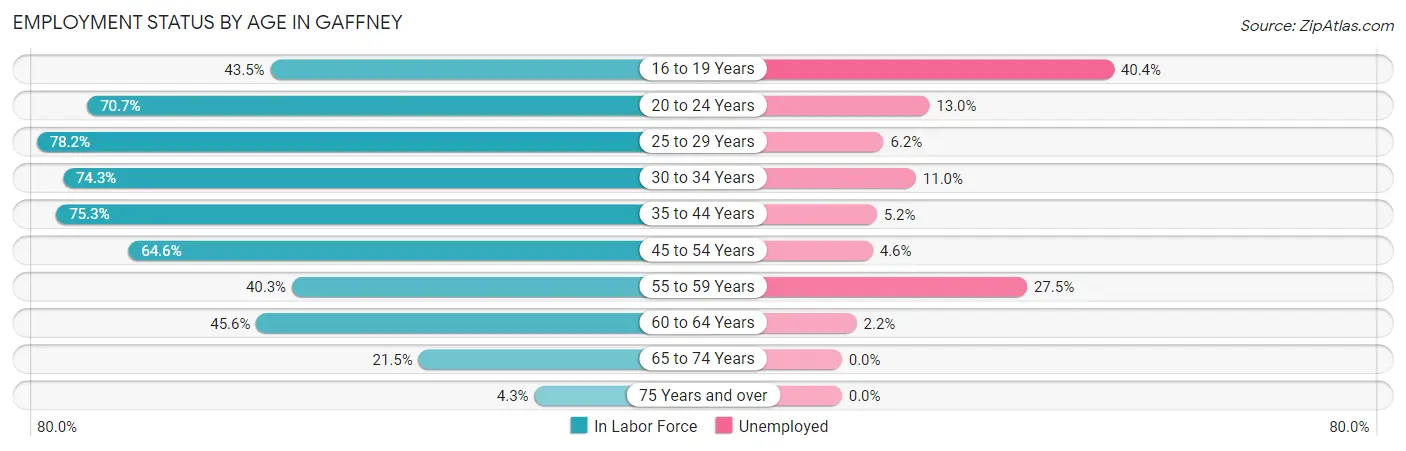
Employment Status by Age in Gaffney
According to the labor force statistics for Gaffney, out of the total population over 16 years of age (10,081), 54.6% or 5,504 individuals are in the labor force, with 9.4% or 517 of them unemployed. The age group with the highest labor force participation rate is 25 to 29 years, with 78.2% or 1,005 individuals in the labor force. Within the labor force, the 16 to 19 years age range has the highest percentage of unemployed individuals, with 40.4% or 145 of them being unemployed.
| Age Bracket | In Labor Force | Unemployed |
| 16 to 19 Years | 359 (43.5%) | 145 (40.4%) |
| 20 to 24 Years | 769 (70.7%) | 100 (13.0%) |
| 25 to 29 Years | 1,005 (78.2%) | 62 (6.2%) |
| 30 to 34 Years | 562 (74.3%) | 62 (11.0%) |
| 35 to 44 Years | 1,087 (75.3%) | 57 (5.2%) |
| 45 to 54 Years | 875 (64.6%) | 40 (4.6%) |
| 55 to 59 Years | 153 (40.3%) | 42 (27.5%) |
| 60 to 64 Years | 415 (45.6%) | 9 (2.2%) |
| 65 to 74 Years | 239 (21.5%) | 0 (0.0%) |
| 75 Years and over | 40 (4.3%) | 0 (0.0%) |
| Total | 5,504 (54.6%) | 517 (9.4%) |
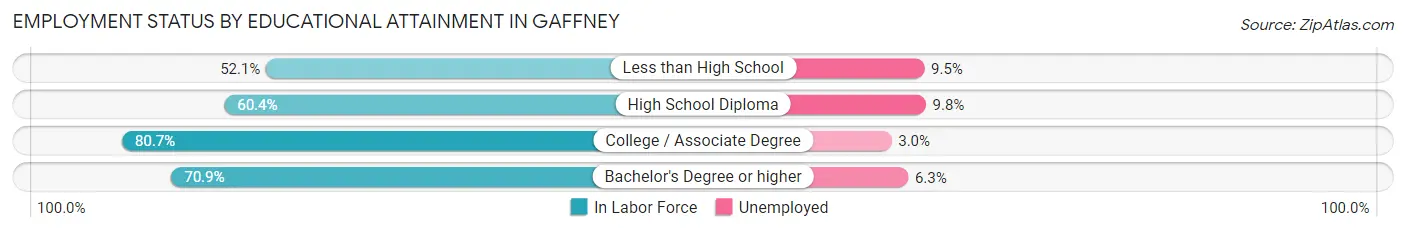
Employment Status by Educational Attainment in Gaffney
According to labor force statistics for Gaffney, 66.8% of individuals (4,094) out of the total population between 25 and 64 years of age (6,129) are in the labor force, with 6.6% or 270 of them being unemployed. The group with the highest labor force participation rate are those with the educational attainment of college / associate degree, with 80.7% or 1,428 individuals in the labor force. Within the labor force, individuals with high school diploma education have the highest percentage of unemployment, with 9.8% or 125 of them being unemployed.
| Educational Attainment | In Labor Force | Unemployed |
| Less than High School | 555 (52.1%) | 101 (9.5%) |
| High School Diploma | 1,274 (60.4%) | 207 (9.8%) |
| College / Associate Degree | 1,428 (80.7%) | 53 (3.0%) |
| Bachelor's Degree or higher | 839 (70.9%) | 75 (6.3%) |
| Total | 4,094 (66.8%) | 405 (6.6%) |
Employment Occupations by Sex in Gaffney
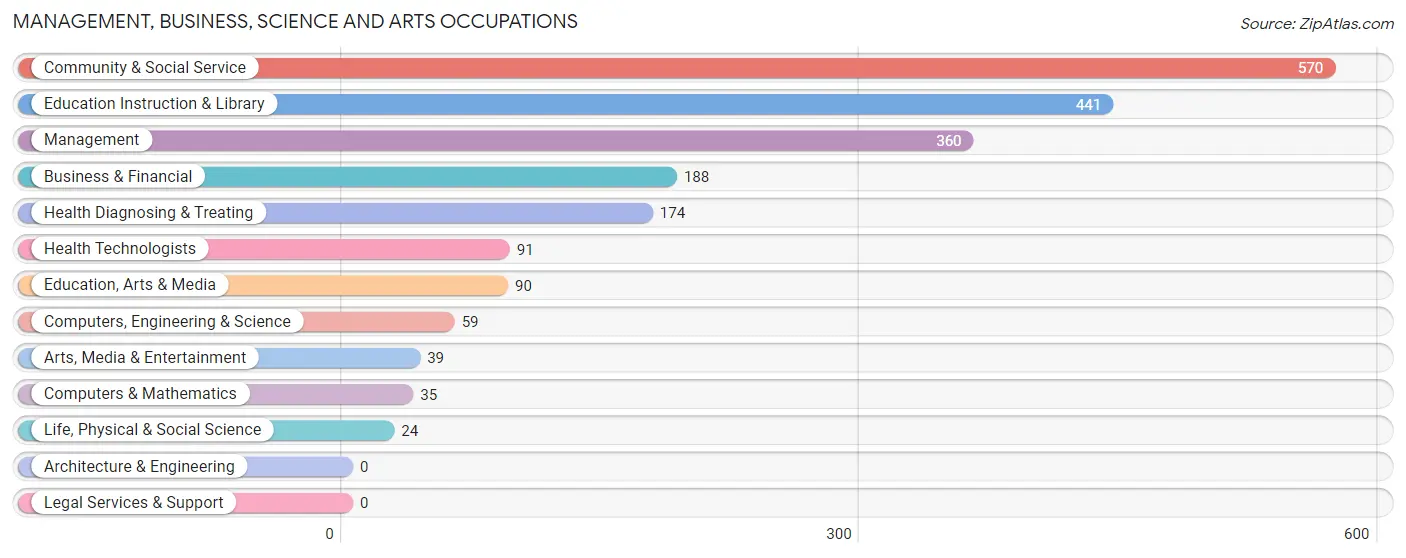
Management, Business, Science and Arts Occupations
The most common Management, Business, Science and Arts occupations in Gaffney are Community & Social Service (570 | 11.5%), Education Instruction & Library (441 | 8.9%), Management (360 | 7.3%), Business & Financial (188 | 3.8%), and Health Diagnosing & Treating (174 | 3.5%).
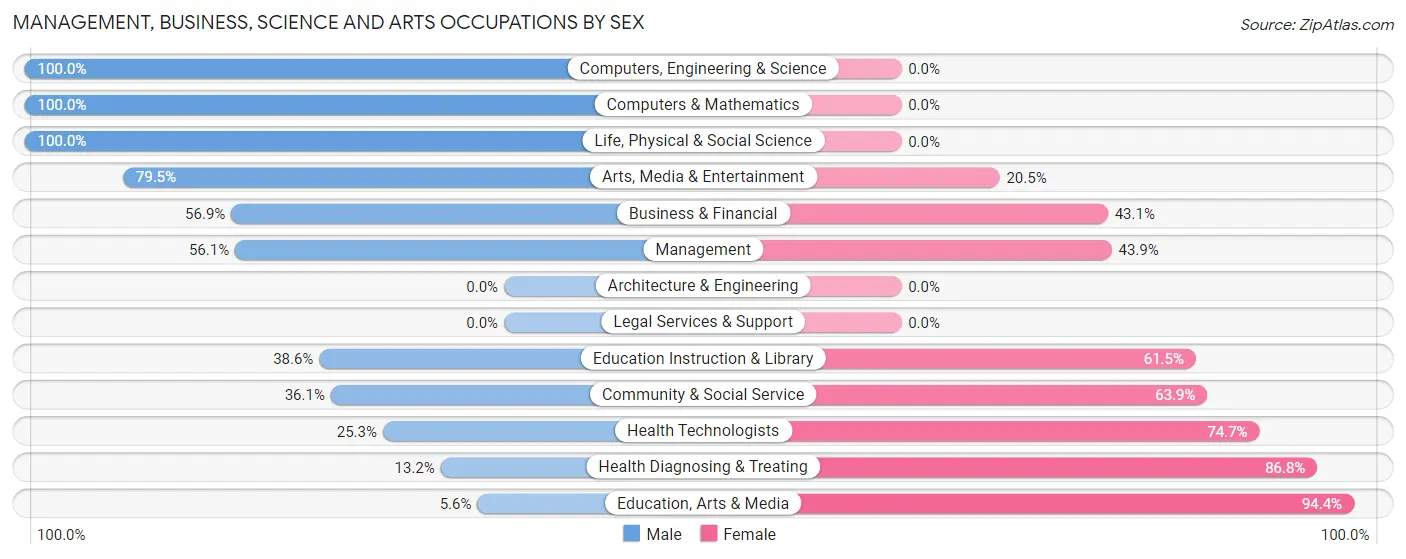
Management, Business, Science and Arts Occupations by Sex
Within the Management, Business, Science and Arts occupations in Gaffney, the most male-oriented occupations are Computers, Engineering & Science (100.0%), Computers & Mathematics (100.0%), and Life, Physical & Social Science (100.0%), while the most female-oriented occupations are Education, Arts & Media (94.4%), Health Diagnosing & Treating (86.8%), and Health Technologists (74.7%).
| Occupation | Male | Female |
| Management | 202 (56.1%) | 158 (43.9%) |
| Business & Financial | 107 (56.9%) | 81 (43.1%) |
| Computers, Engineering & Science | 59 (100.0%) | 0 (0.0%) |
| Computers & Mathematics | 35 (100.0%) | 0 (0.0%) |
| Architecture & Engineering | 0 (0.0%) | 0 (0.0%) |
| Life, Physical & Social Science | 24 (100.0%) | 0 (0.0%) |
| Community & Social Service | 206 (36.1%) | 364 (63.9%) |
| Education, Arts & Media | 5 (5.6%) | 85 (94.4%) |
| Legal Services & Support | 0 (0.0%) | 0 (0.0%) |
| Education Instruction & Library | 170 (38.6%) | 271 (61.5%) |
| Arts, Media & Entertainment | 31 (79.5%) | 8 (20.5%) |
| Health Diagnosing & Treating | 23 (13.2%) | 151 (86.8%) |
| Health Technologists | 23 (25.3%) | 68 (74.7%) |
| Total (Category) | 597 (44.2%) | 754 (55.8%) |
| Total (Overall) | 2,381 (48.1%) | 2,573 (51.9%) |
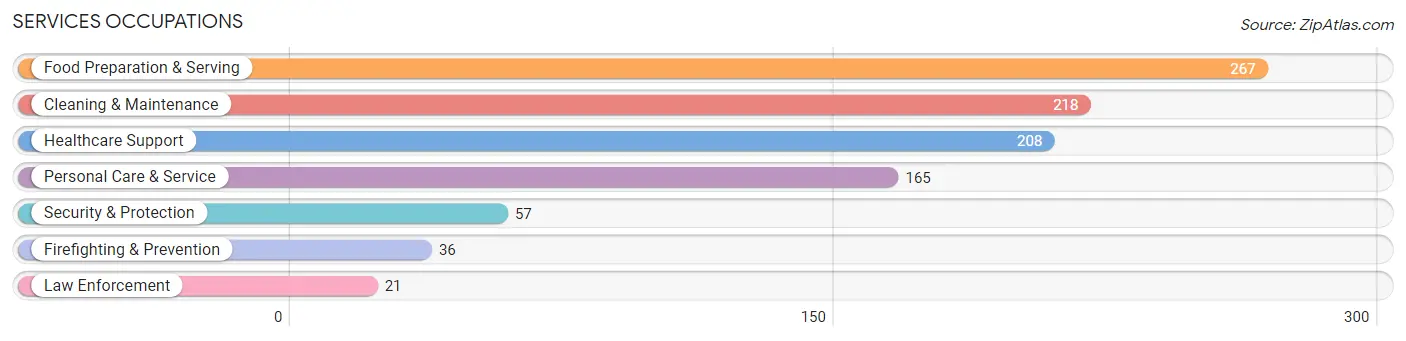
Services Occupations
The most common Services occupations in Gaffney are Food Preparation & Serving (267 | 5.4%), Cleaning & Maintenance (218 | 4.4%), Healthcare Support (208 | 4.2%), Personal Care & Service (165 | 3.3%), and Security & Protection (57 | 1.1%).
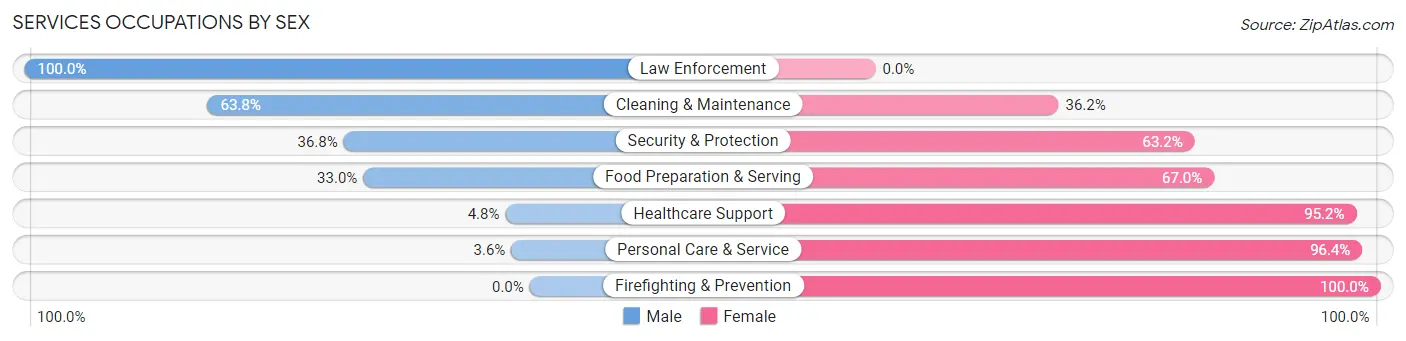
Services Occupations by Sex
Within the Services occupations in Gaffney, the most male-oriented occupations are Law Enforcement (100.0%), Cleaning & Maintenance (63.8%), and Security & Protection (36.8%), while the most female-oriented occupations are Firefighting & Prevention (100.0%), Personal Care & Service (96.4%), and Healthcare Support (95.2%).
| Occupation | Male | Female |
| Healthcare Support | 10 (4.8%) | 198 (95.2%) |
| Security & Protection | 21 (36.8%) | 36 (63.2%) |
| Firefighting & Prevention | 0 (0.0%) | 36 (100.0%) |
| Law Enforcement | 21 (100.0%) | 0 (0.0%) |
| Food Preparation & Serving | 88 (33.0%) | 179 (67.0%) |
| Cleaning & Maintenance | 139 (63.8%) | 79 (36.2%) |
| Personal Care & Service | 6 (3.6%) | 159 (96.4%) |
| Total (Category) | 264 (28.8%) | 651 (71.2%) |
| Total (Overall) | 2,381 (48.1%) | 2,573 (51.9%) |
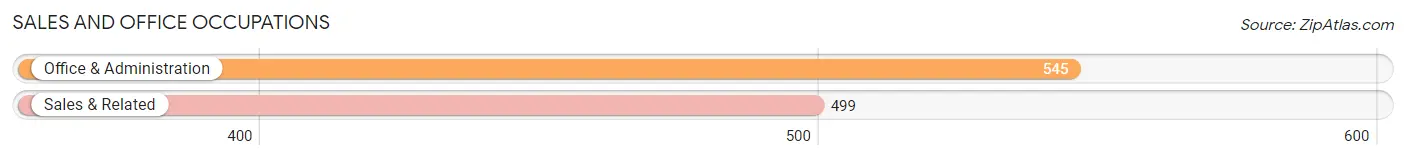
Sales and Office Occupations
The most common Sales and Office occupations in Gaffney are Office & Administration (545 | 11.0%), and Sales & Related (499 | 10.1%).
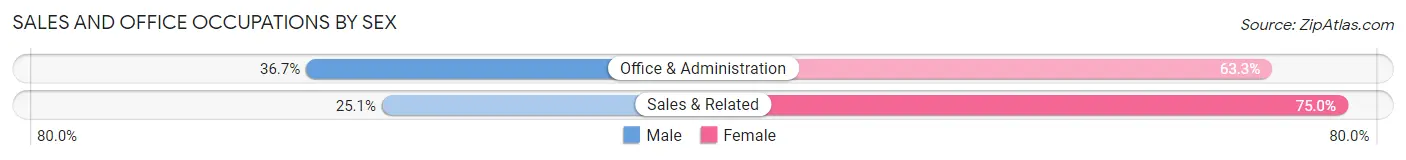
Sales and Office Occupations by Sex
| Occupation | Male | Female |
| Sales & Related | 125 (25.1%) | 374 (75.0%) |
| Office & Administration | 200 (36.7%) | 345 (63.3%) |
| Total (Category) | 325 (31.1%) | 719 (68.9%) |
| Total (Overall) | 2,381 (48.1%) | 2,573 (51.9%) |
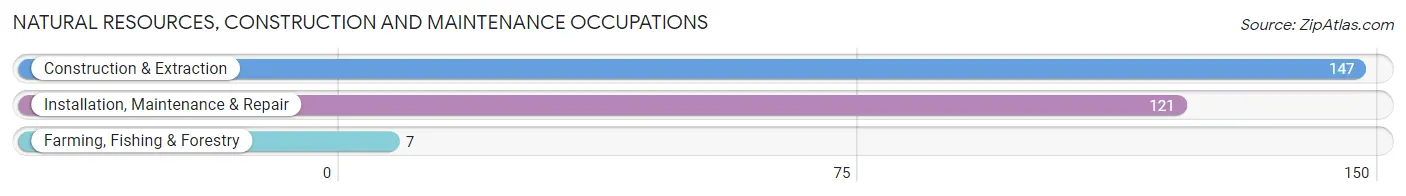
Natural Resources, Construction and Maintenance Occupations
The most common Natural Resources, Construction and Maintenance occupations in Gaffney are Construction & Extraction (147 | 3.0%), Installation, Maintenance & Repair (121 | 2.4%), and Farming, Fishing & Forestry (7 | 0.1%).
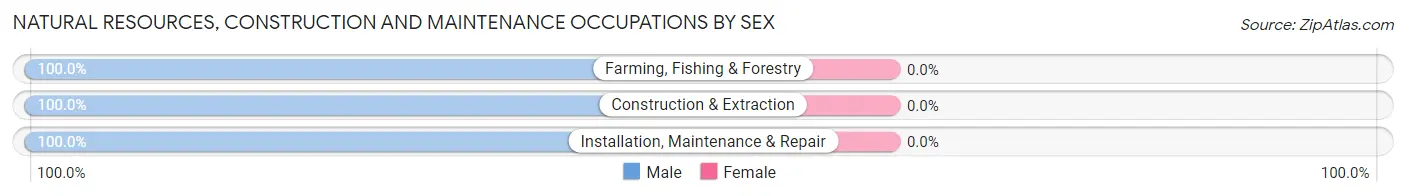
Natural Resources, Construction and Maintenance Occupations by Sex
| Occupation | Male | Female |
| Farming, Fishing & Forestry | 7 (100.0%) | 0 (0.0%) |
| Construction & Extraction | 147 (100.0%) | 0 (0.0%) |
| Installation, Maintenance & Repair | 121 (100.0%) | 0 (0.0%) |
| Total (Category) | 275 (100.0%) | 0 (0.0%) |
| Total (Overall) | 2,381 (48.1%) | 2,573 (51.9%) |
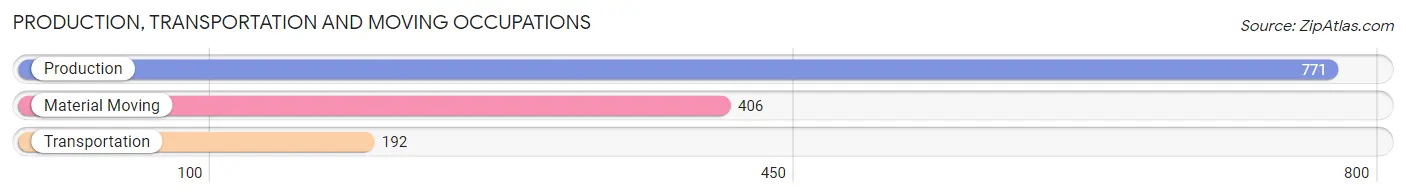
Production, Transportation and Moving Occupations
The most common Production, Transportation and Moving occupations in Gaffney are Production (771 | 15.6%), Material Moving (406 | 8.2%), and Transportation (192 | 3.9%).
Production, Transportation and Moving Occupations by Sex
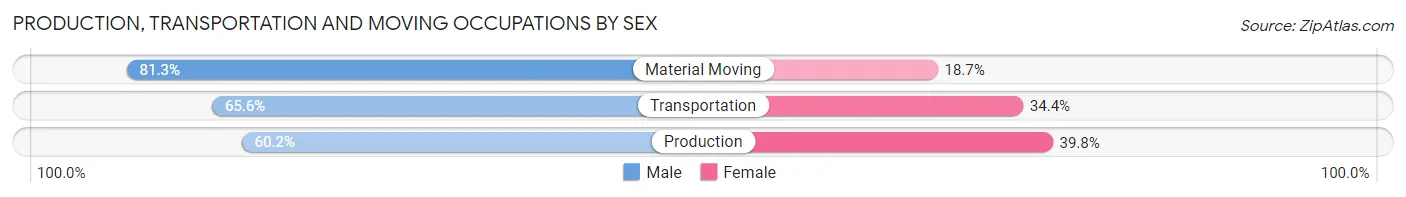
| Occupation | Male | Female |
| Production | 464 (60.2%) | 307 (39.8%) |
| Transportation | 126 (65.6%) | 66 (34.4%) |
| Material Moving | 330 (81.3%) | 76 (18.7%) |
| Total (Category) | 920 (67.2%) | 449 (32.8%) |
| Total (Overall) | 2,381 (48.1%) | 2,573 (51.9%) |
Employment Industries by Sex in Gaffney
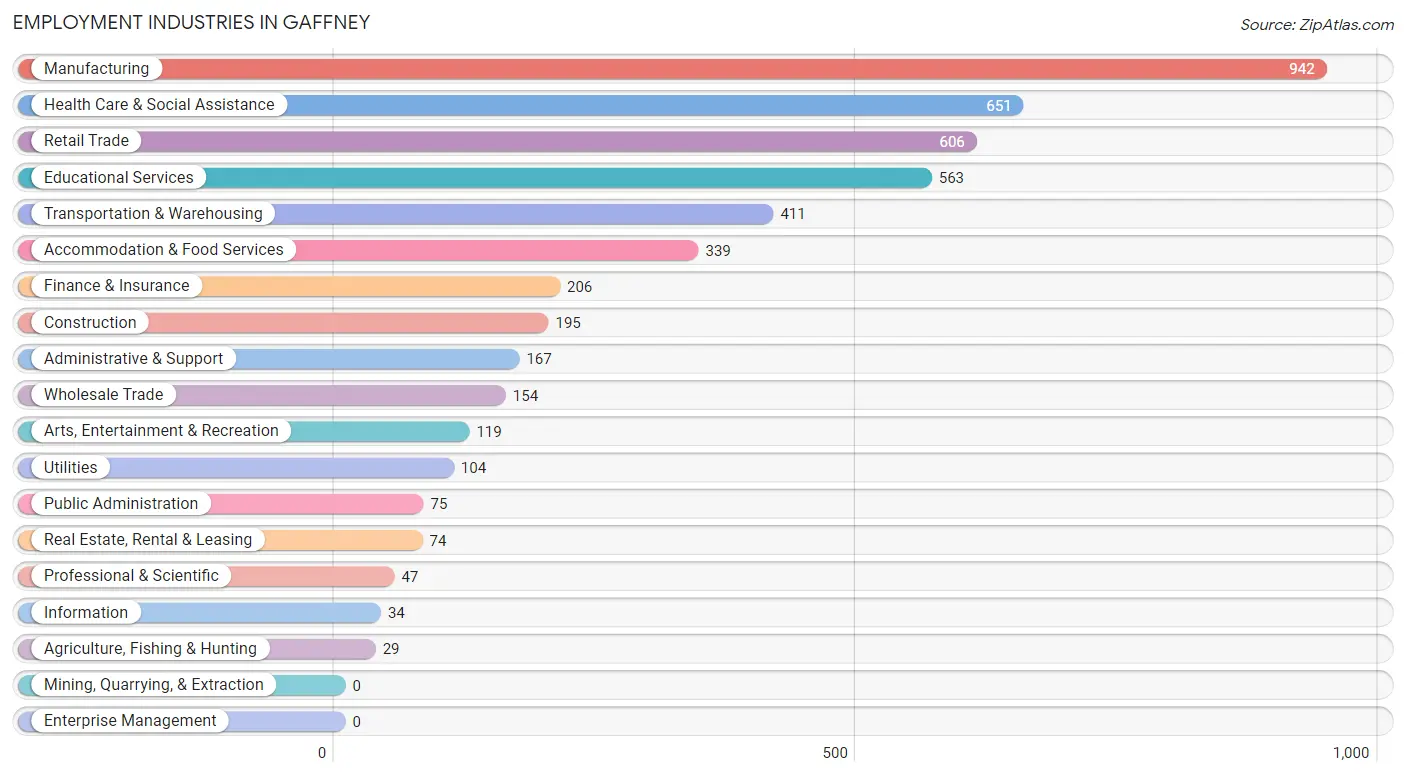
Employment Industries in Gaffney
The major employment industries in Gaffney include Manufacturing (942 | 19.0%), Health Care & Social Assistance (651 | 13.1%), Retail Trade (606 | 12.2%), Educational Services (563 | 11.4%), and Transportation & Warehousing (411 | 8.3%).
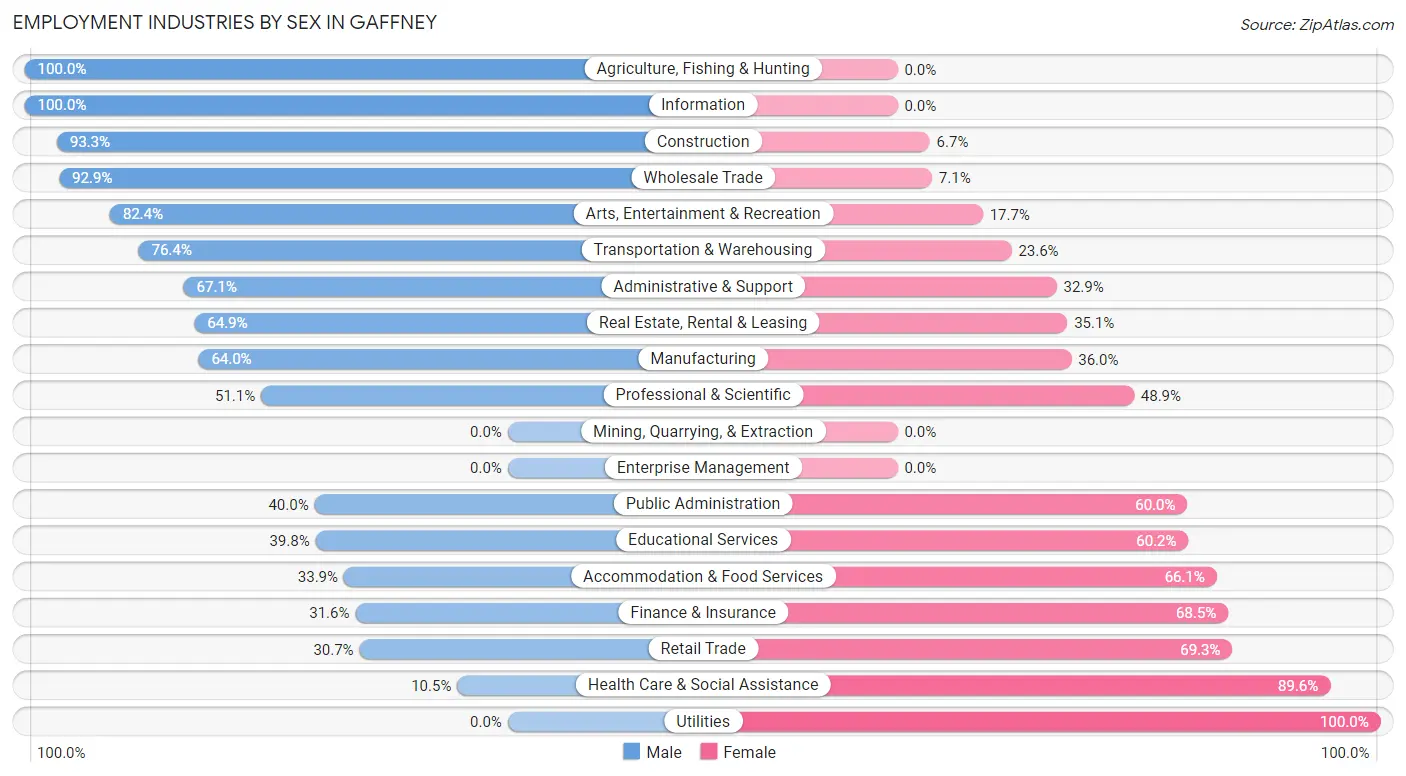
Employment Industries by Sex in Gaffney
The Gaffney industries that see more men than women are Agriculture, Fishing & Hunting (100.0%), Information (100.0%), and Construction (93.3%), whereas the industries that tend to have a higher number of women are Utilities (100.0%), Health Care & Social Assistance (89.5%), and Retail Trade (69.3%).
| Industry | Male | Female |
| Agriculture, Fishing & Hunting | 29 (100.0%) | 0 (0.0%) |
| Mining, Quarrying, & Extraction | 0 (0.0%) | 0 (0.0%) |
| Construction | 182 (93.3%) | 13 (6.7%) |
| Manufacturing | 603 (64.0%) | 339 (36.0%) |
| Wholesale Trade | 143 (92.9%) | 11 (7.1%) |
| Retail Trade | 186 (30.7%) | 420 (69.3%) |
| Transportation & Warehousing | 314 (76.4%) | 97 (23.6%) |
| Utilities | 0 (0.0%) | 104 (100.0%) |
| Information | 34 (100.0%) | 0 (0.0%) |
| Finance & Insurance | 65 (31.6%) | 141 (68.4%) |
| Real Estate, Rental & Leasing | 48 (64.9%) | 26 (35.1%) |
| Professional & Scientific | 24 (51.1%) | 23 (48.9%) |
| Enterprise Management | 0 (0.0%) | 0 (0.0%) |
| Administrative & Support | 112 (67.1%) | 55 (32.9%) |
| Educational Services | 224 (39.8%) | 339 (60.2%) |
| Health Care & Social Assistance | 68 (10.4%) | 583 (89.5%) |
| Arts, Entertainment & Recreation | 98 (82.4%) | 21 (17.6%) |
| Accommodation & Food Services | 115 (33.9%) | 224 (66.1%) |
| Public Administration | 30 (40.0%) | 45 (60.0%) |
| Total | 2,381 (48.1%) | 2,573 (51.9%) |
Education in Gaffney
School Enrollment in Gaffney
The most common levels of schooling among the 3,140 students in Gaffney are college / undergraduate (1,078 | 34.3%), elementary school (632 | 20.1%), and middle school (566 | 18.0%).
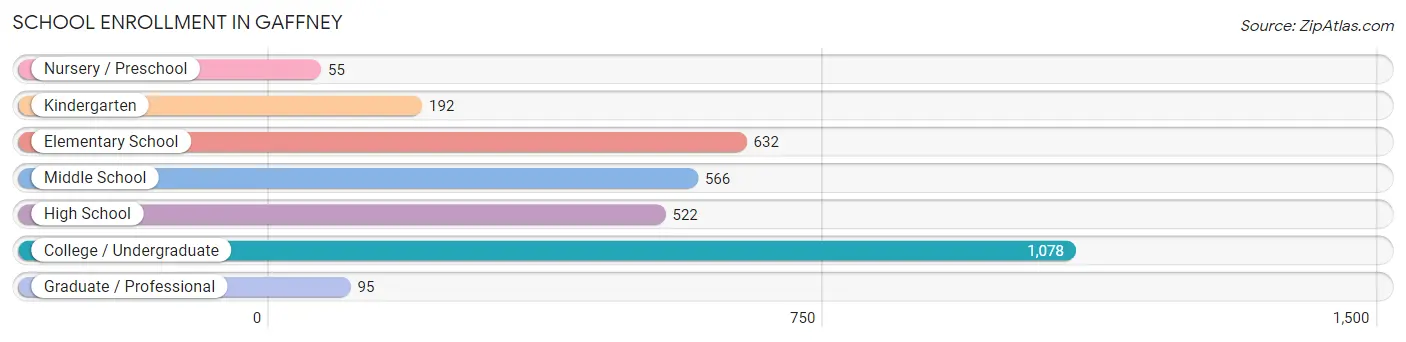
| School Level | # Students | % Students |
| Nursery / Preschool | 55 | 1.8% |
| Kindergarten | 192 | 6.1% |
| Elementary School | 632 | 20.1% |
| Middle School | 566 | 18.0% |
| High School | 522 | 16.6% |
| College / Undergraduate | 1,078 | 34.3% |
| Graduate / Professional | 95 | 3.0% |
| Total | 3,140 | 100.0% |
School Enrollment by Age by Funding Source in Gaffney
Out of a total of 3,140 students who are enrolled in schools in Gaffney, 794 (25.3%) attend a private institution, while the remaining 2,346 (74.7%) are enrolled in public schools. The age group of 20 to 24 year olds has the highest likelihood of being enrolled in private schools, with 479 (76.8% in the age bracket) enrolled. Conversely, the age group of 3 to 4 year olds has the lowest likelihood of being enrolled in a private school, with 55 (100.0% in the age bracket) attending a public institution.
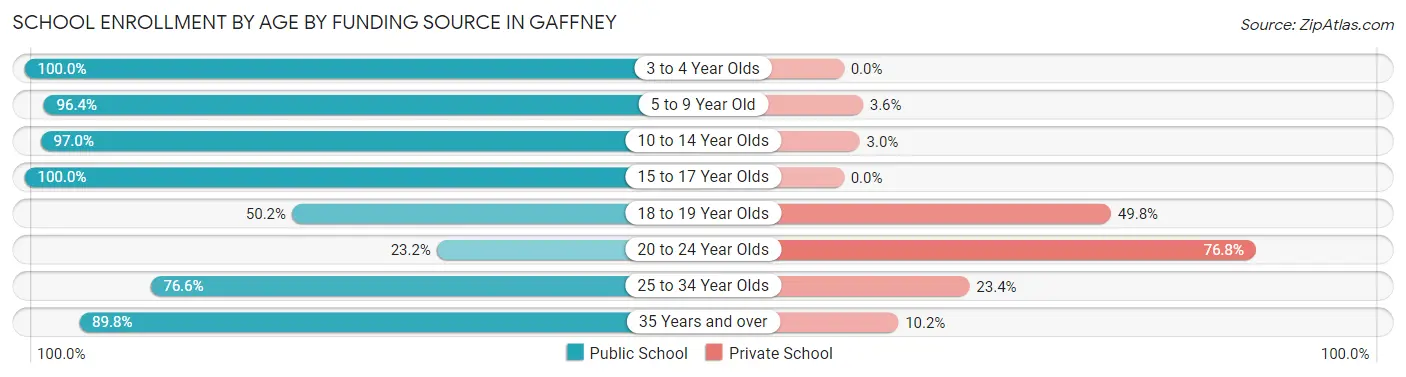
| Age Bracket | Public School | Private School |
| 3 to 4 Year Olds | 55 (100.0%) | 0 (0.0%) |
| 5 to 9 Year Old | 732 (96.4%) | 27 (3.6%) |
| 10 to 14 Year Olds | 654 (97.0%) | 20 (3.0%) |
| 15 to 17 Year Olds | 331 (100.0%) | 0 (0.0%) |
| 18 to 19 Year Olds | 230 (50.2%) | 228 (49.8%) |
| 20 to 24 Year Olds | 145 (23.2%) | 479 (76.8%) |
| 25 to 34 Year Olds | 85 (76.6%) | 26 (23.4%) |
| 35 Years and over | 115 (89.8%) | 13 (10.2%) |
| Total | 2,346 (74.7%) | 794 (25.3%) |
Educational Attainment by Field of Study in Gaffney
Education (428 | 25.8%), business (400 | 24.1%), science & technology (132 | 8.0%), visual & performing arts (132 | 8.0%), and psychology (109 | 6.6%) are the most common fields of study among 1,660 individuals in Gaffney who have obtained a bachelor's degree or higher.
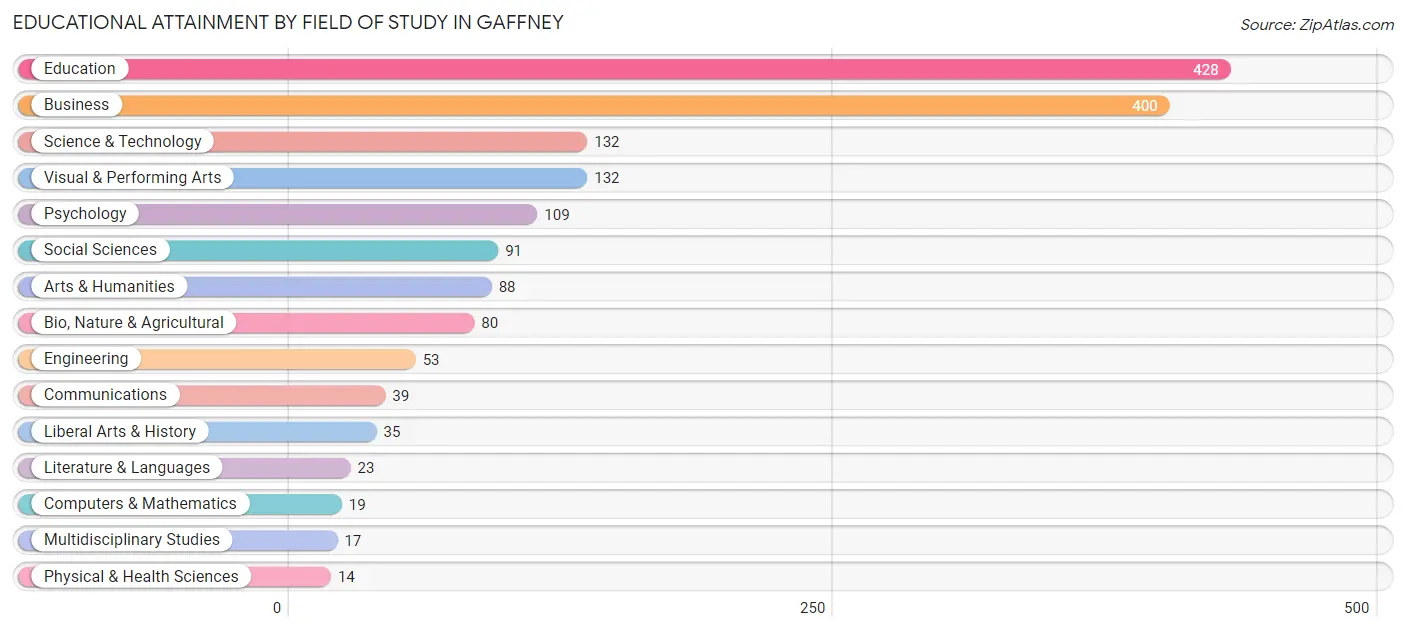
| Field of Study | # Graduates | % Graduates |
| Computers & Mathematics | 19 | 1.1% |
| Bio, Nature & Agricultural | 80 | 4.8% |
| Physical & Health Sciences | 14 | 0.8% |
| Psychology | 109 | 6.6% |
| Social Sciences | 91 | 5.5% |
| Engineering | 53 | 3.2% |
| Multidisciplinary Studies | 17 | 1.0% |
| Science & Technology | 132 | 8.0% |
| Business | 400 | 24.1% |
| Education | 428 | 25.8% |
| Literature & Languages | 23 | 1.4% |
| Liberal Arts & History | 35 | 2.1% |
| Visual & Performing Arts | 132 | 8.0% |
| Communications | 39 | 2.4% |
| Arts & Humanities | 88 | 5.3% |
| Total | 1,660 | 100.0% |
Transportation & Commute in Gaffney
Vehicle Availability by Sex in Gaffney
The most prevalent vehicle ownership categories in Gaffney are males with 2 vehicles (791, accounting for 33.8%) and females with 2 vehicles (803, making up 34.8%).
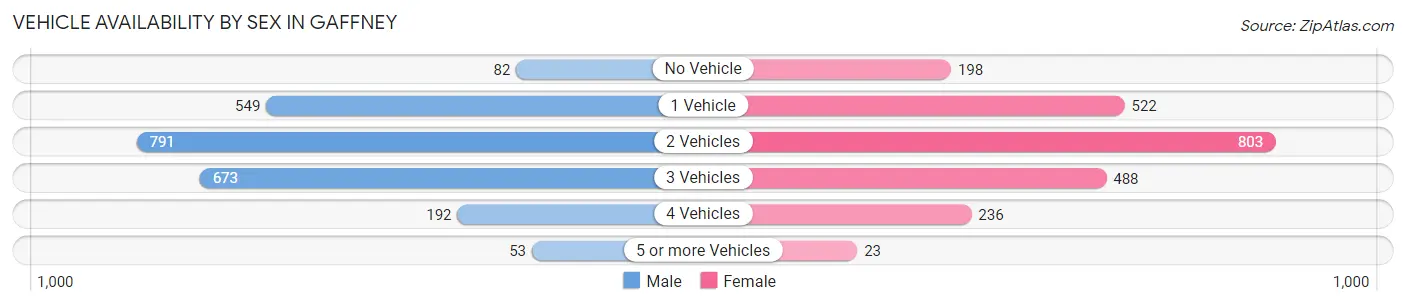
| Vehicles Available | Male | Female |
| No Vehicle | 82 (3.5%) | 198 (8.7%) |
| 1 Vehicle | 549 (23.5%) | 522 (23.0%) |
| 2 Vehicles | 791 (33.8%) | 803 (35.4%) |
| 3 Vehicles | 673 (28.8%) | 488 (21.5%) |
| 4 Vehicles | 192 (8.2%) | 236 (10.4%) |
| 5 or more Vehicles | 53 (2.3%) | 23 (1.0%) |
| Total | 2,340 (100.0%) | 2,270 (100.0%) |
Commute Time in Gaffney
The most frequently occuring commute durations in Gaffney are 5 to 9 minutes (1,052 commuters, 22.9%), 10 to 14 minutes (913 commuters, 19.8%), and 15 to 19 minutes (455 commuters, 9.9%).
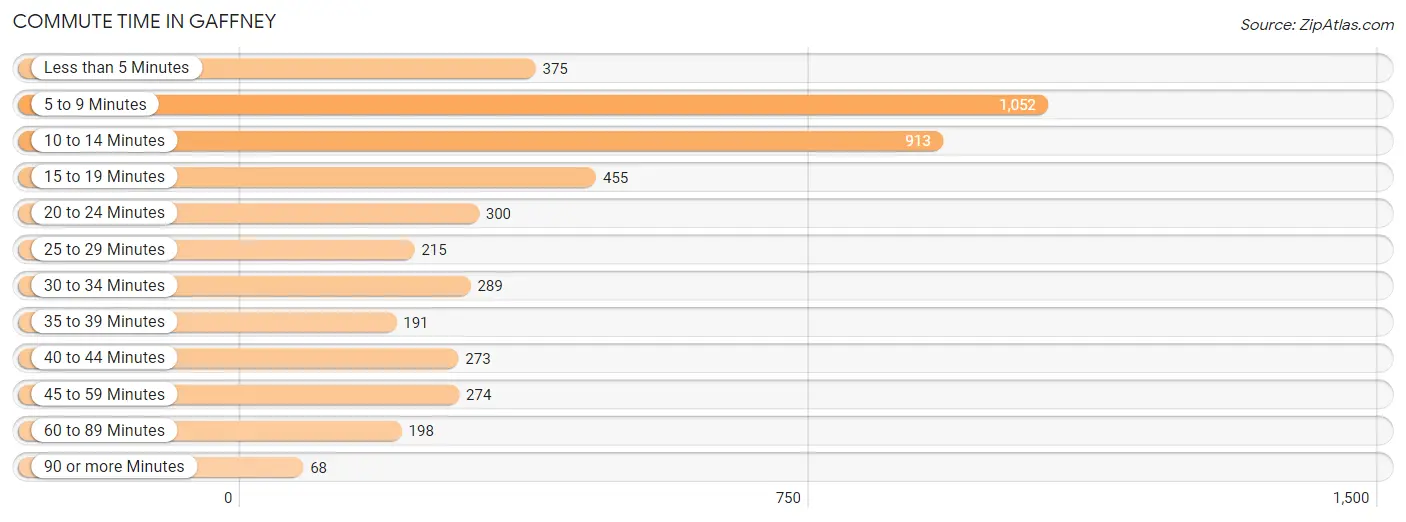
| Commute Time | # Commuters | % Commuters |
| Less than 5 Minutes | 375 | 8.2% |
| 5 to 9 Minutes | 1,052 | 22.9% |
| 10 to 14 Minutes | 913 | 19.8% |
| 15 to 19 Minutes | 455 | 9.9% |
| 20 to 24 Minutes | 300 | 6.5% |
| 25 to 29 Minutes | 215 | 4.7% |
| 30 to 34 Minutes | 289 | 6.3% |
| 35 to 39 Minutes | 191 | 4.2% |
| 40 to 44 Minutes | 273 | 5.9% |
| 45 to 59 Minutes | 274 | 5.9% |
| 60 to 89 Minutes | 198 | 4.3% |
| 90 or more Minutes | 68 | 1.5% |
Commute Time by Sex in Gaffney
The most common commute times in Gaffney are 5 to 9 minutes (423 commuters, 18.4%) for males and 5 to 9 minutes (629 commuters, 27.3%) for females.
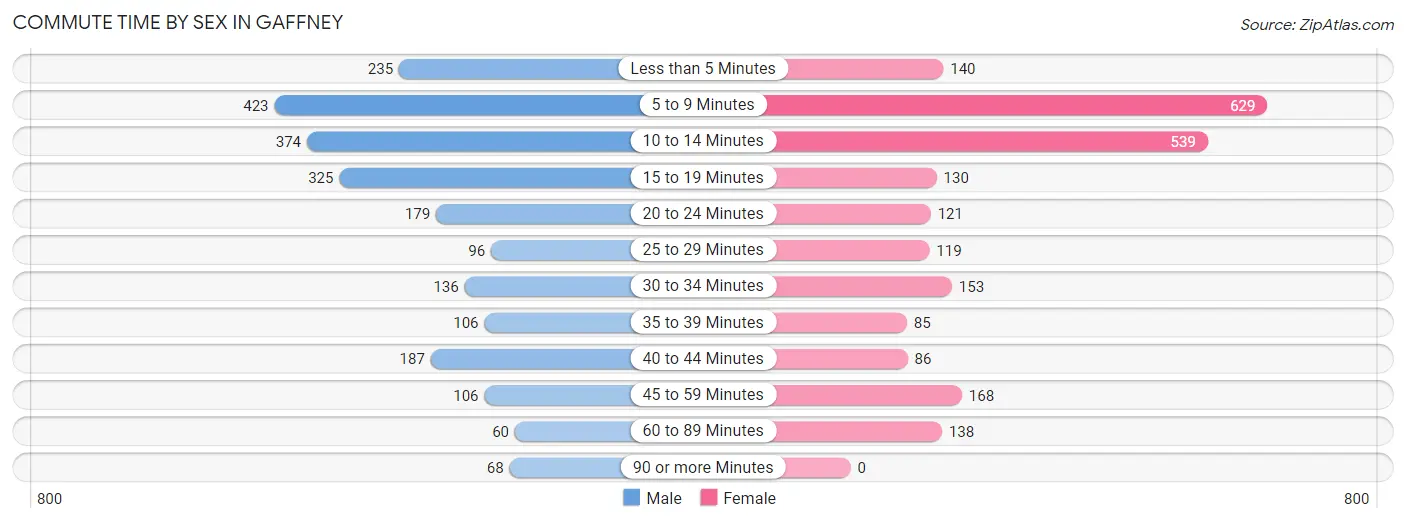
| Commute Time | Male | Female |
| Less than 5 Minutes | 235 (10.2%) | 140 (6.1%) |
| 5 to 9 Minutes | 423 (18.4%) | 629 (27.3%) |
| 10 to 14 Minutes | 374 (16.3%) | 539 (23.4%) |
| 15 to 19 Minutes | 325 (14.2%) | 130 (5.6%) |
| 20 to 24 Minutes | 179 (7.8%) | 121 (5.2%) |
| 25 to 29 Minutes | 96 (4.2%) | 119 (5.2%) |
| 30 to 34 Minutes | 136 (5.9%) | 153 (6.6%) |
| 35 to 39 Minutes | 106 (4.6%) | 85 (3.7%) |
| 40 to 44 Minutes | 187 (8.2%) | 86 (3.7%) |
| 45 to 59 Minutes | 106 (4.6%) | 168 (7.3%) |
| 60 to 89 Minutes | 60 (2.6%) | 138 (6.0%) |
| 90 or more Minutes | 68 (3.0%) | 0 (0.0%) |
Time of Departure to Work by Sex in Gaffney
The most frequent times of departure to work in Gaffney are 6:30 AM to 6:59 AM (349, 15.2%) for males and 4:00 PM to 11:59 PM (395, 17.1%) for females.
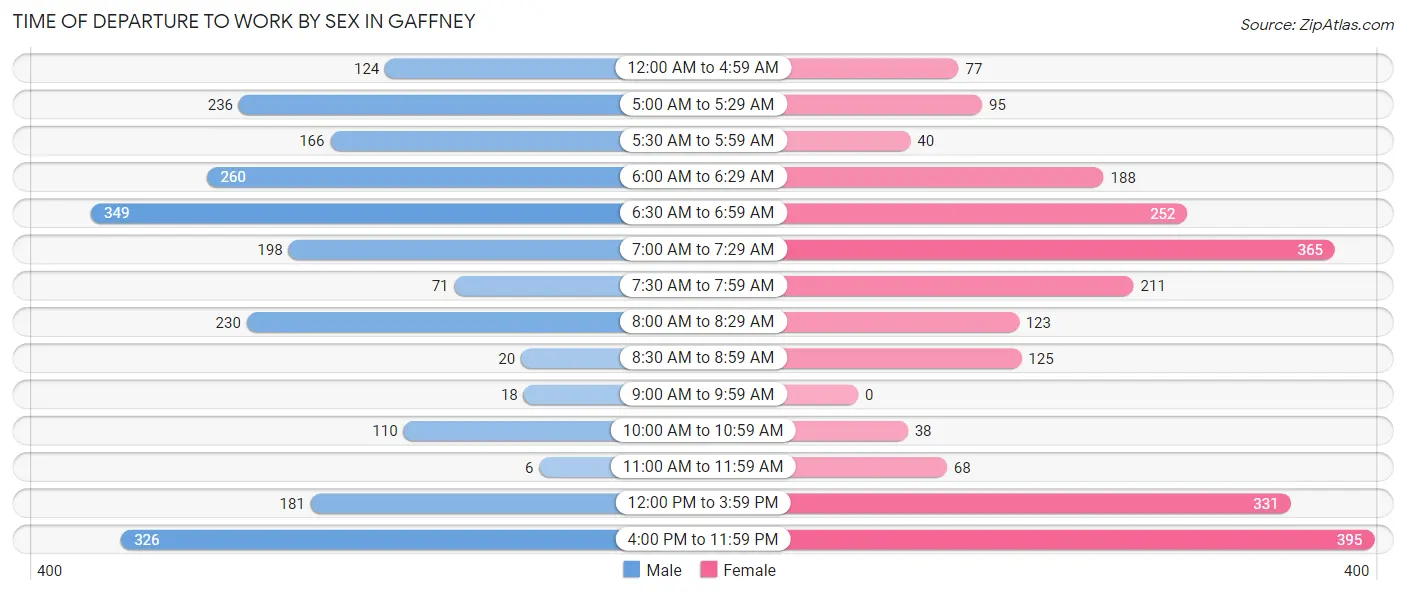
| Time of Departure | Male | Female |
| 12:00 AM to 4:59 AM | 124 (5.4%) | 77 (3.3%) |
| 5:00 AM to 5:29 AM | 236 (10.3%) | 95 (4.1%) |
| 5:30 AM to 5:59 AM | 166 (7.2%) | 40 (1.7%) |
| 6:00 AM to 6:29 AM | 260 (11.3%) | 188 (8.2%) |
| 6:30 AM to 6:59 AM | 349 (15.2%) | 252 (10.9%) |
| 7:00 AM to 7:29 AM | 198 (8.6%) | 365 (15.8%) |
| 7:30 AM to 7:59 AM | 71 (3.1%) | 211 (9.1%) |
| 8:00 AM to 8:29 AM | 230 (10.0%) | 123 (5.3%) |
| 8:30 AM to 8:59 AM | 20 (0.9%) | 125 (5.4%) |
| 9:00 AM to 9:59 AM | 18 (0.8%) | 0 (0.0%) |
| 10:00 AM to 10:59 AM | 110 (4.8%) | 38 (1.7%) |
| 11:00 AM to 11:59 AM | 6 (0.3%) | 68 (2.9%) |
| 12:00 PM to 3:59 PM | 181 (7.9%) | 331 (14.3%) |
| 4:00 PM to 11:59 PM | 326 (14.2%) | 395 (17.1%) |
| Total | 2,295 (100.0%) | 2,308 (100.0%) |
Housing Occupancy in Gaffney
Occupancy by Ownership in Gaffney
Of the total 4,611 dwellings in Gaffney, owner-occupied units account for 2,444 (53.0%), while renter-occupied units make up 2,167 (47.0%).
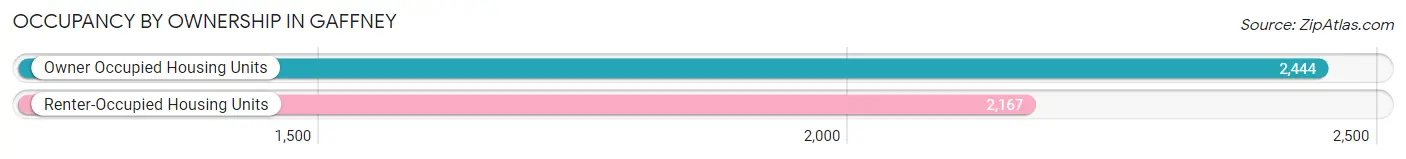
| Occupancy | # Housing Units | % Housing Units |
| Owner Occupied Housing Units | 2,444 | 53.0% |
| Renter-Occupied Housing Units | 2,167 | 47.0% |
| Total Occupied Housing Units | 4,611 | 100.0% |
Occupancy by Household Size in Gaffney
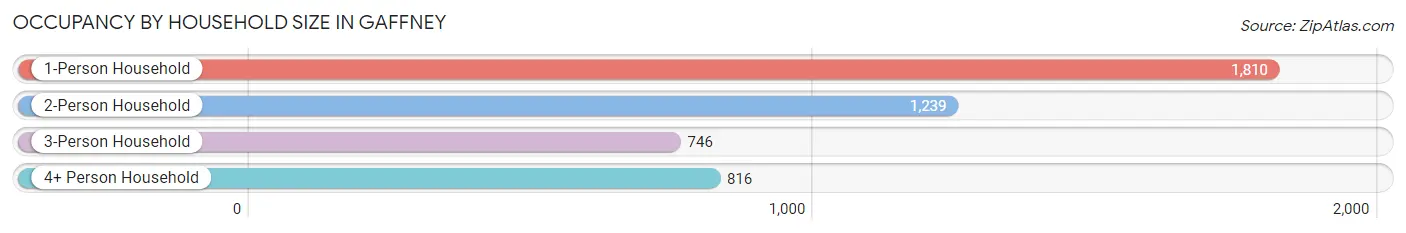
| Household Size | # Housing Units | % Housing Units |
| 1-Person Household | 1,810 | 39.3% |
| 2-Person Household | 1,239 | 26.9% |
| 3-Person Household | 746 | 16.2% |
| 4+ Person Household | 816 | 17.7% |
| Total Housing Units | 4,611 | 100.0% |
Occupancy by Ownership by Household Size in Gaffney
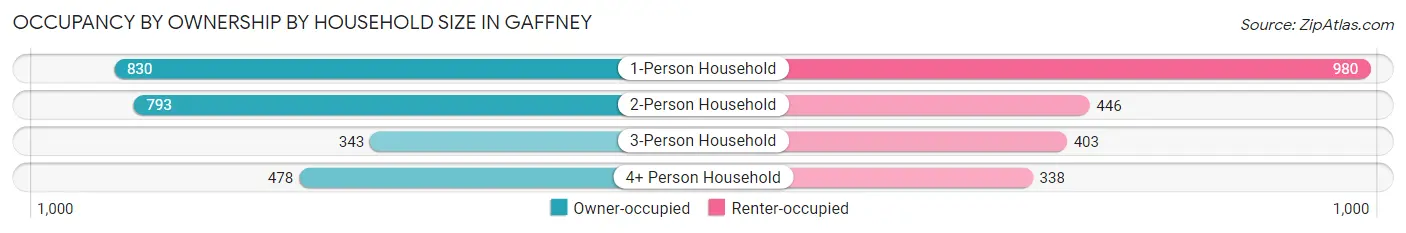
| Household Size | Owner-occupied | Renter-occupied |
| 1-Person Household | 830 (45.9%) | 980 (54.1%) |
| 2-Person Household | 793 (64.0%) | 446 (36.0%) |
| 3-Person Household | 343 (46.0%) | 403 (54.0%) |
| 4+ Person Household | 478 (58.6%) | 338 (41.4%) |
| Total Housing Units | 2,444 (53.0%) | 2,167 (47.0%) |
Occupancy by Educational Attainment in Gaffney
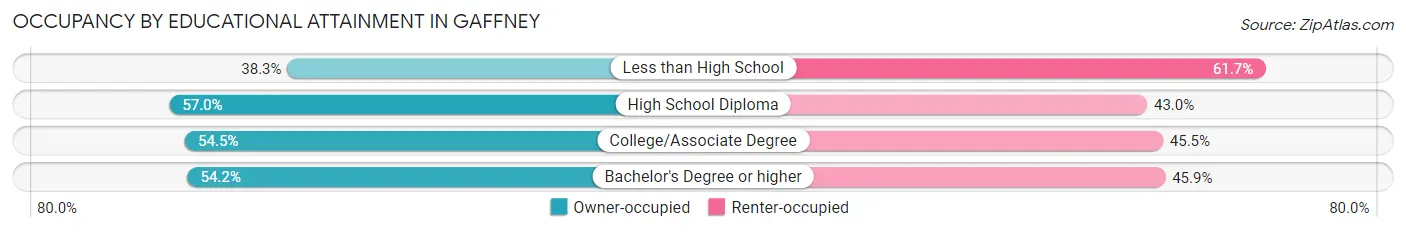
| Household Size | Owner-occupied | Renter-occupied |
| Less than High School | 251 (38.3%) | 404 (61.7%) |
| High School Diploma | 892 (57.0%) | 672 (43.0%) |
| College/Associate Degree | 825 (54.5%) | 688 (45.5%) |
| Bachelor's Degree or higher | 476 (54.1%) | 403 (45.9%) |
Occupancy by Age of Householder in Gaffney
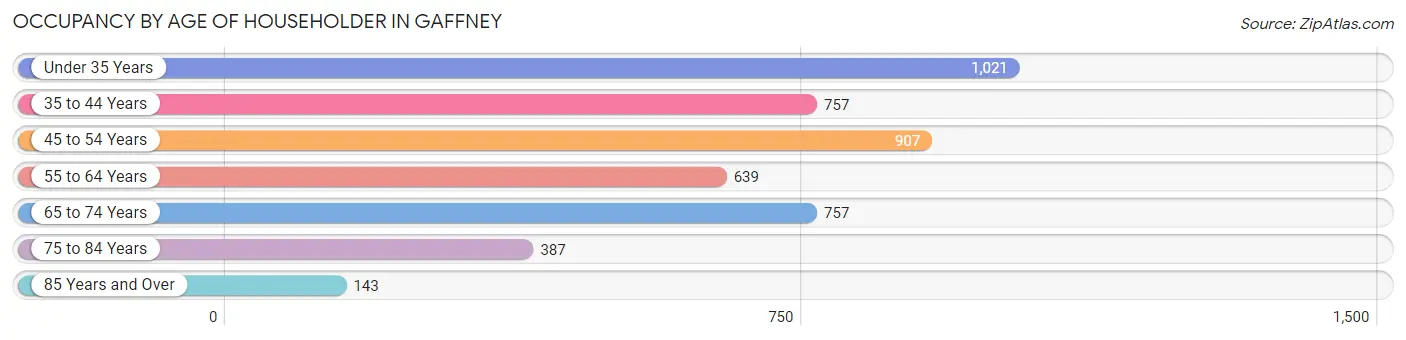
| Age Bracket | # Households | % Households |
| Under 35 Years | 1,021 | 22.1% |
| 35 to 44 Years | 757 | 16.4% |
| 45 to 54 Years | 907 | 19.7% |
| 55 to 64 Years | 639 | 13.9% |
| 65 to 74 Years | 757 | 16.4% |
| 75 to 84 Years | 387 | 8.4% |
| 85 Years and Over | 143 | 3.1% |
| Total | 4,611 | 100.0% |
Housing Finances in Gaffney
Median Income by Occupancy in Gaffney
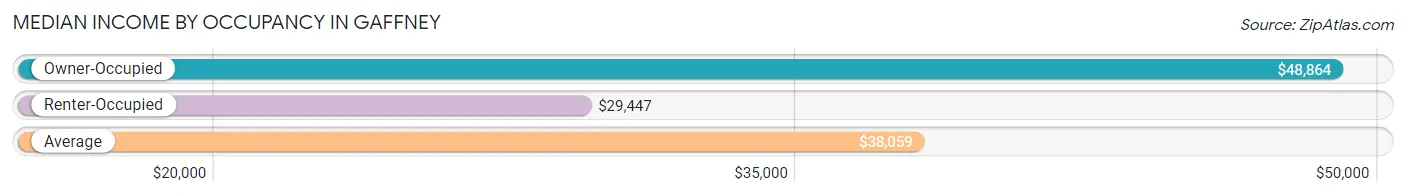
| Occupancy Type | # Households | Median Income |
| Owner-Occupied | 2,444 (53.0%) | $48,864 |
| Renter-Occupied | 2,167 (47.0%) | $29,447 |
| Average | 4,611 (100.0%) | $38,059 |
Occupancy by Householder Income Bracket in Gaffney
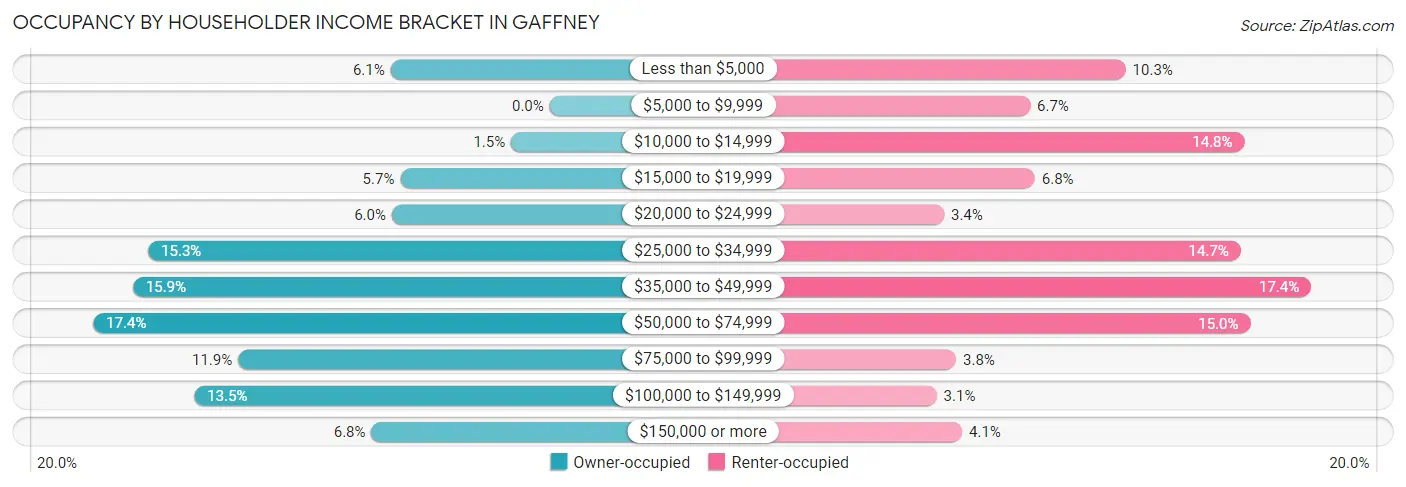
| Income Bracket | Owner-occupied | Renter-occupied |
| Less than $5,000 | 148 (6.1%) | 223 (10.3%) |
| $5,000 to $9,999 | 0 (0.0%) | 144 (6.7%) |
| $10,000 to $14,999 | 36 (1.5%) | 321 (14.8%) |
| $15,000 to $19,999 | 139 (5.7%) | 148 (6.8%) |
| $20,000 to $24,999 | 147 (6.0%) | 73 (3.4%) |
| $25,000 to $34,999 | 374 (15.3%) | 318 (14.7%) |
| $35,000 to $49,999 | 388 (15.9%) | 376 (17.3%) |
| $50,000 to $74,999 | 425 (17.4%) | 326 (15.0%) |
| $75,000 to $99,999 | 290 (11.9%) | 83 (3.8%) |
| $100,000 to $149,999 | 331 (13.5%) | 67 (3.1%) |
| $150,000 or more | 166 (6.8%) | 88 (4.1%) |
| Total | 2,444 (100.0%) | 2,167 (100.0%) |
Monthly Housing Cost Tiers in Gaffney
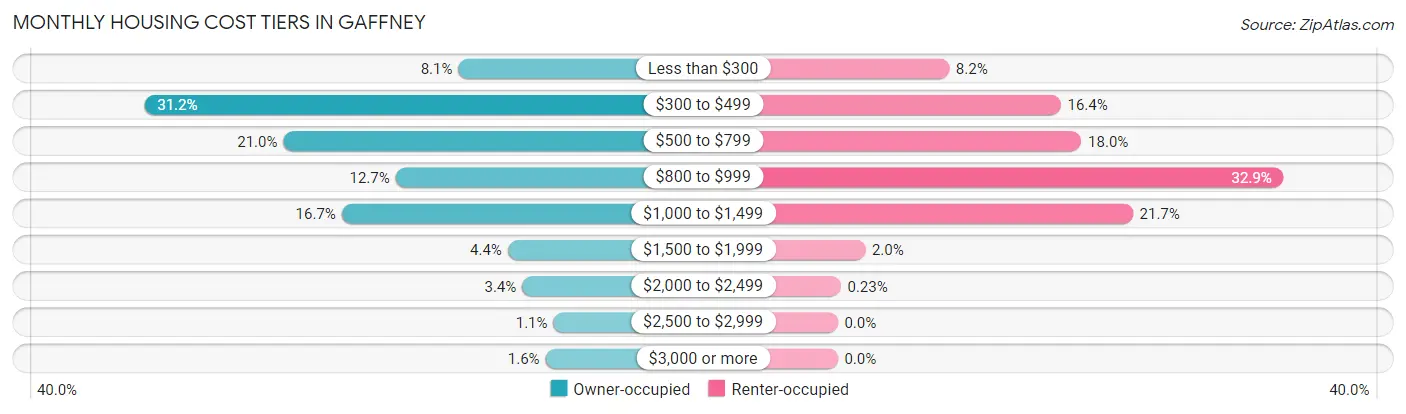
| Monthly Cost | Owner-occupied | Renter-occupied |
| Less than $300 | 197 (8.1%) | 178 (8.2%) |
| $300 to $499 | 762 (31.2%) | 356 (16.4%) |
| $500 to $799 | 512 (20.9%) | 389 (17.9%) |
| $800 to $999 | 310 (12.7%) | 712 (32.9%) |
| $1,000 to $1,499 | 407 (16.7%) | 471 (21.7%) |
| $1,500 to $1,999 | 108 (4.4%) | 44 (2.0%) |
| $2,000 to $2,499 | 82 (3.4%) | 5 (0.2%) |
| $2,500 to $2,999 | 26 (1.1%) | 0 (0.0%) |
| $3,000 or more | 40 (1.6%) | 0 (0.0%) |
| Total | 2,444 (100.0%) | 2,167 (100.0%) |
Physical Housing Characteristics in Gaffney
Housing Structures in Gaffney
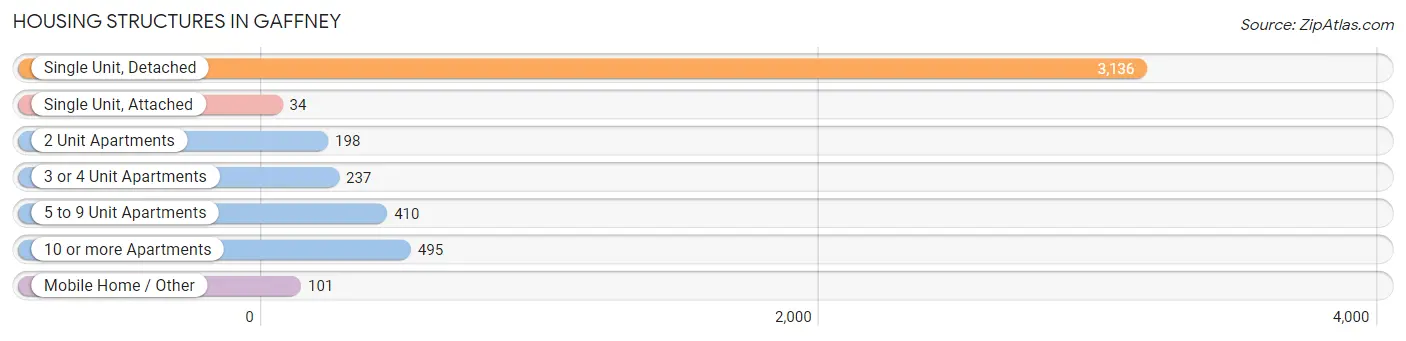
| Structure Type | # Housing Units | % Housing Units |
| Single Unit, Detached | 3,136 | 68.0% |
| Single Unit, Attached | 34 | 0.7% |
| 2 Unit Apartments | 198 | 4.3% |
| 3 or 4 Unit Apartments | 237 | 5.1% |
| 5 to 9 Unit Apartments | 410 | 8.9% |
| 10 or more Apartments | 495 | 10.7% |
| Mobile Home / Other | 101 | 2.2% |
| Total | 4,611 | 100.0% |
Housing Structures by Occupancy in Gaffney
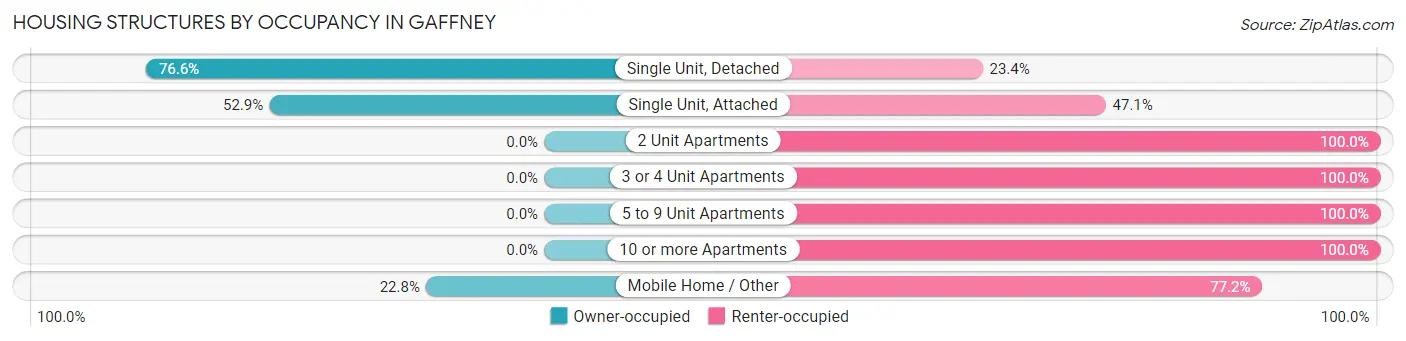
| Structure Type | Owner-occupied | Renter-occupied |
| Single Unit, Detached | 2,403 (76.6%) | 733 (23.4%) |
| Single Unit, Attached | 18 (52.9%) | 16 (47.1%) |
| 2 Unit Apartments | 0 (0.0%) | 198 (100.0%) |
| 3 or 4 Unit Apartments | 0 (0.0%) | 237 (100.0%) |
| 5 to 9 Unit Apartments | 0 (0.0%) | 410 (100.0%) |
| 10 or more Apartments | 0 (0.0%) | 495 (100.0%) |
| Mobile Home / Other | 23 (22.8%) | 78 (77.2%) |
| Total | 2,444 (53.0%) | 2,167 (47.0%) |
Housing Structures by Number of Rooms in Gaffney
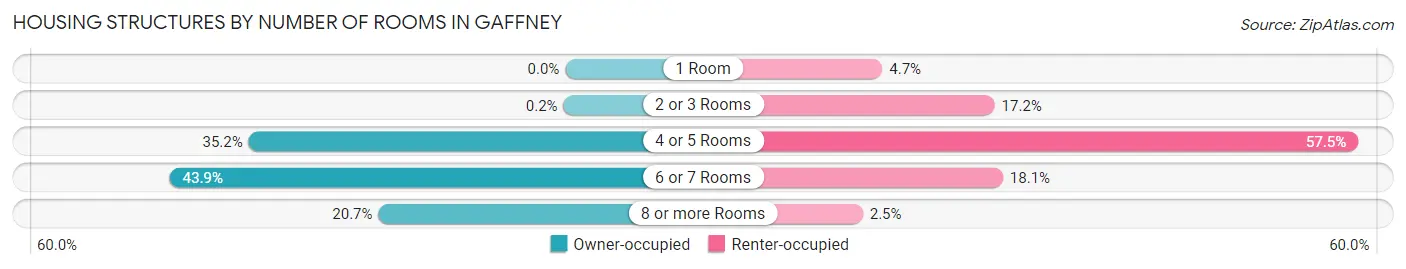
| Number of Rooms | Owner-occupied | Renter-occupied |
| 1 Room | 0 (0.0%) | 102 (4.7%) |
| 2 or 3 Rooms | 5 (0.2%) | 372 (17.2%) |
| 4 or 5 Rooms | 859 (35.1%) | 1,246 (57.5%) |
| 6 or 7 Rooms | 1,073 (43.9%) | 392 (18.1%) |
| 8 or more Rooms | 507 (20.7%) | 55 (2.5%) |
| Total | 2,444 (100.0%) | 2,167 (100.0%) |
Housing Structure by Heating Type in Gaffney
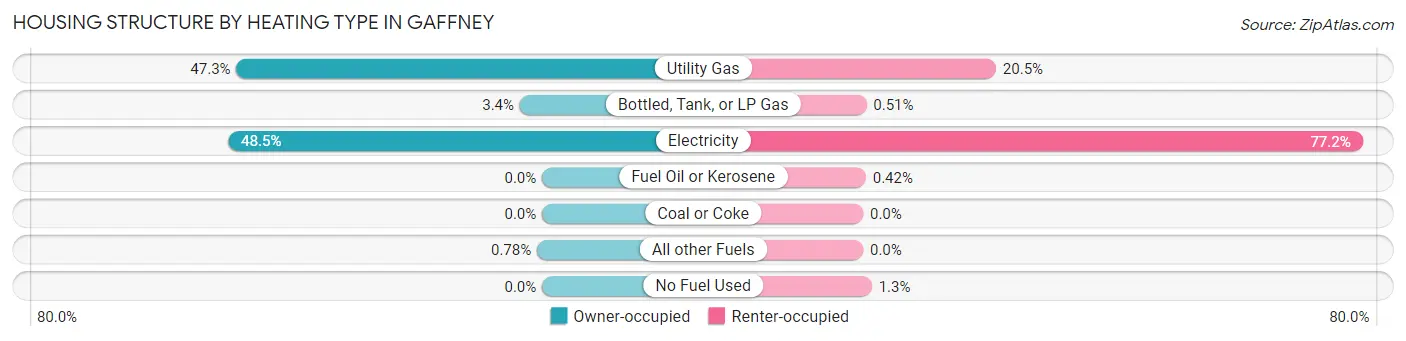
| Heating Type | Owner-occupied | Renter-occupied |
| Utility Gas | 1,155 (47.3%) | 445 (20.5%) |
| Bottled, Tank, or LP Gas | 84 (3.4%) | 11 (0.5%) |
| Electricity | 1,186 (48.5%) | 1,673 (77.2%) |
| Fuel Oil or Kerosene | 0 (0.0%) | 9 (0.4%) |
| Coal or Coke | 0 (0.0%) | 0 (0.0%) |
| All other Fuels | 19 (0.8%) | 0 (0.0%) |
| No Fuel Used | 0 (0.0%) | 29 (1.3%) |
| Total | 2,444 (100.0%) | 2,167 (100.0%) |
Household Vehicle Usage in Gaffney
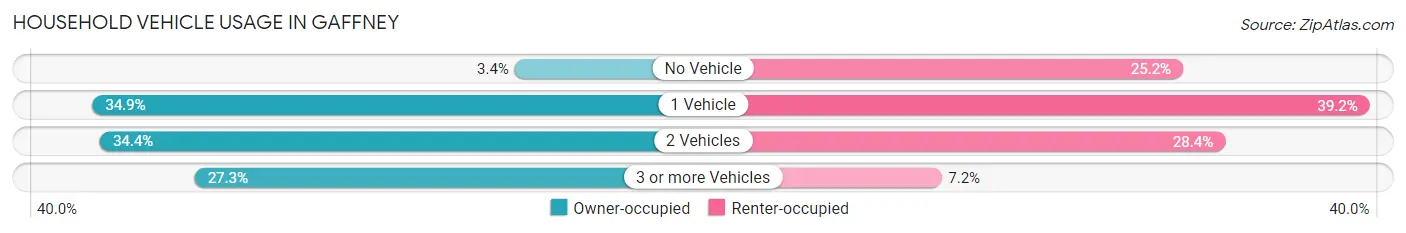
| Vehicles per Household | Owner-occupied | Renter-occupied |
| No Vehicle | 83 (3.4%) | 547 (25.2%) |
| 1 Vehicle | 854 (34.9%) | 849 (39.2%) |
| 2 Vehicles | 840 (34.4%) | 615 (28.4%) |
| 3 or more Vehicles | 667 (27.3%) | 156 (7.2%) |
| Total | 2,444 (100.0%) | 2,167 (100.0%) |
Real Estate & Mortgages in Gaffney
Real Estate and Mortgage Overview in Gaffney
| Characteristic | Without Mortgage | With Mortgage |
| Housing Units | 1,138 | 1,306 |
| Median Property Value | $110,800 | $137,000 |
| Median Household Income | $38,088 | $102 |
| Monthly Housing Costs | $381 | $40 |
| Real Estate Taxes | $613 | $50 |
Property Value by Mortgage Status in Gaffney
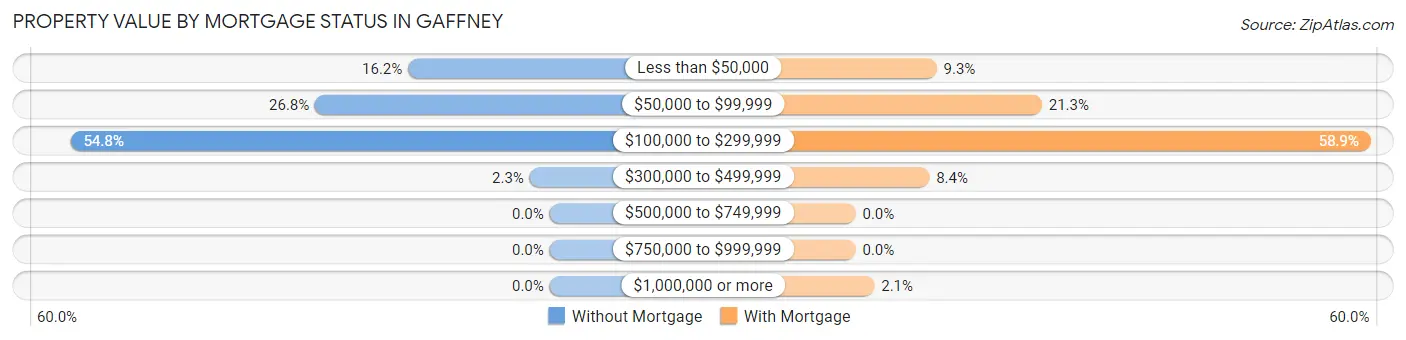
| Property Value | Without Mortgage | With Mortgage |
| Less than $50,000 | 184 (16.2%) | 121 (9.3%) |
| $50,000 to $99,999 | 305 (26.8%) | 278 (21.3%) |
| $100,000 to $299,999 | 623 (54.7%) | 769 (58.9%) |
| $300,000 to $499,999 | 26 (2.3%) | 110 (8.4%) |
| $500,000 to $749,999 | 0 (0.0%) | 0 (0.0%) |
| $750,000 to $999,999 | 0 (0.0%) | 0 (0.0%) |
| $1,000,000 or more | 0 (0.0%) | 28 (2.1%) |
| Total | 1,138 (100.0%) | 1,306 (100.0%) |
Household Income by Mortgage Status in Gaffney
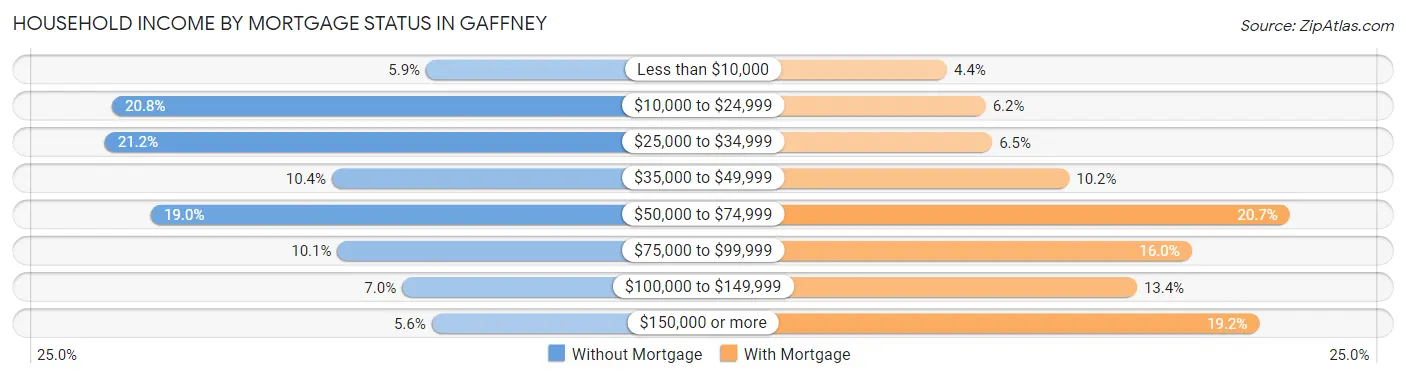
| Household Income | Without Mortgage | With Mortgage |
| Less than $10,000 | 67 (5.9%) | 57 (4.4%) |
| $10,000 to $24,999 | 237 (20.8%) | 81 (6.2%) |
| $25,000 to $34,999 | 241 (21.2%) | 85 (6.5%) |
| $35,000 to $49,999 | 118 (10.4%) | 133 (10.2%) |
| $50,000 to $74,999 | 216 (19.0%) | 270 (20.7%) |
| $75,000 to $99,999 | 115 (10.1%) | 209 (16.0%) |
| $100,000 to $149,999 | 80 (7.0%) | 175 (13.4%) |
| $150,000 or more | 64 (5.6%) | 251 (19.2%) |
| Total | 1,138 (100.0%) | 1,306 (100.0%) |
Property Value to Household Income Ratio in Gaffney
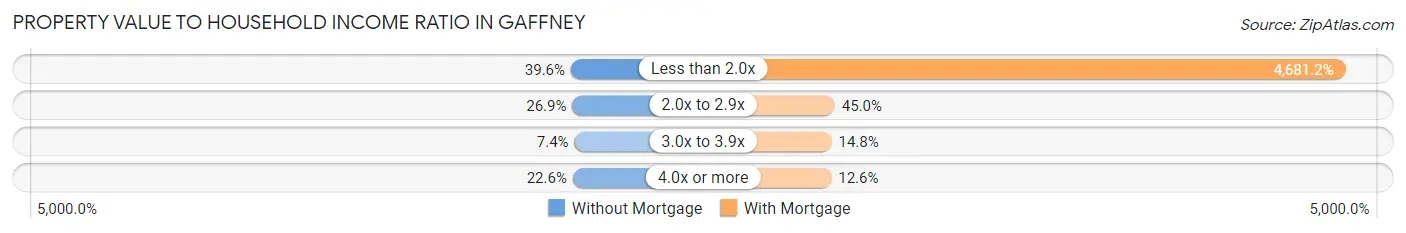
| Value-to-Income Ratio | Without Mortgage | With Mortgage |
| Less than 2.0x | 451 (39.6%) | 61,136 (4,681.2%) |
| 2.0x to 2.9x | 306 (26.9%) | 588 (45.0%) |
| 3.0x to 3.9x | 84 (7.4%) | 193 (14.8%) |
| 4.0x or more | 257 (22.6%) | 165 (12.6%) |
| Total | 1,138 (100.0%) | 1,306 (100.0%) |
Real Estate Taxes by Mortgage Status in Gaffney
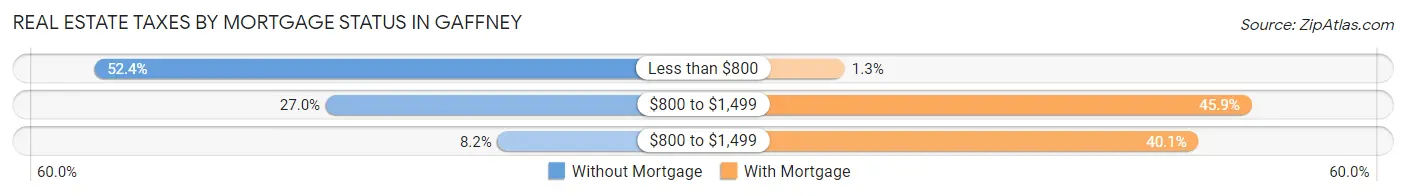
| Property Taxes | Without Mortgage | With Mortgage |
| Less than $800 | 596 (52.4%) | 17 (1.3%) |
| $800 to $1,499 | 307 (27.0%) | 599 (45.9%) |
| $800 to $1,499 | 93 (8.2%) | 523 (40.1%) |
| Total | 1,138 (100.0%) | 1,306 (100.0%) |
Health & Disability in Gaffney
Health Insurance Coverage by Age in Gaffney
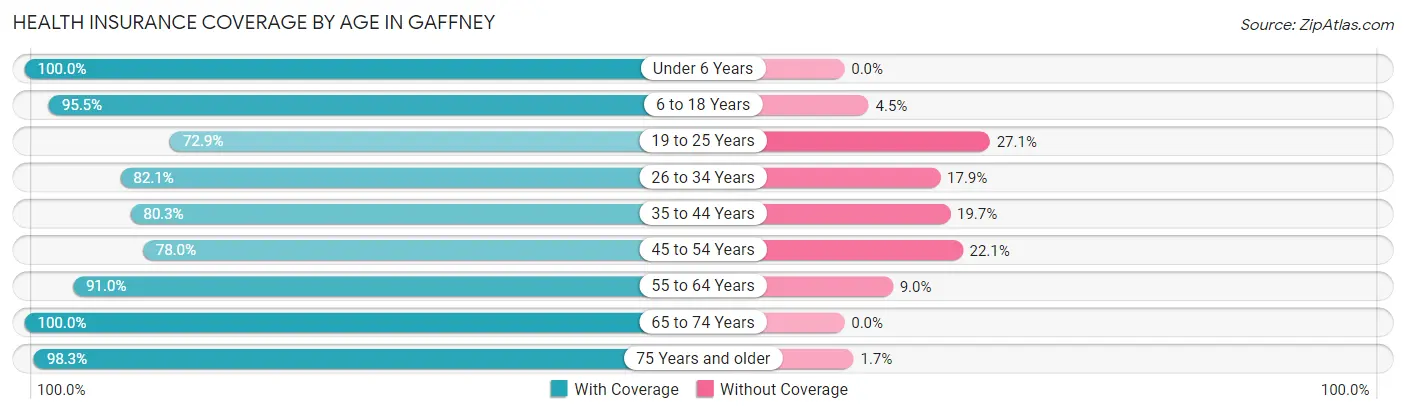
| Age Bracket | With Coverage | Without Coverage |
| Under 6 Years | 1,149 (100.0%) | 0 (0.0%) |
| 6 to 18 Years | 1,772 (95.5%) | 84 (4.5%) |
| 19 to 25 Years | 1,188 (72.9%) | 442 (27.1%) |
| 26 to 34 Years | 1,466 (82.1%) | 319 (17.9%) |
| 35 to 44 Years | 1,091 (80.3%) | 268 (19.7%) |
| 45 to 54 Years | 1,050 (77.9%) | 297 (22.1%) |
| 55 to 64 Years | 1,158 (91.0%) | 115 (9.0%) |
| 65 to 74 Years | 1,058 (100.0%) | 0 (0.0%) |
| 75 Years and older | 744 (98.3%) | 13 (1.7%) |
| Total | 10,676 (87.4%) | 1,538 (12.6%) |
Health Insurance Coverage by Citizenship Status in Gaffney
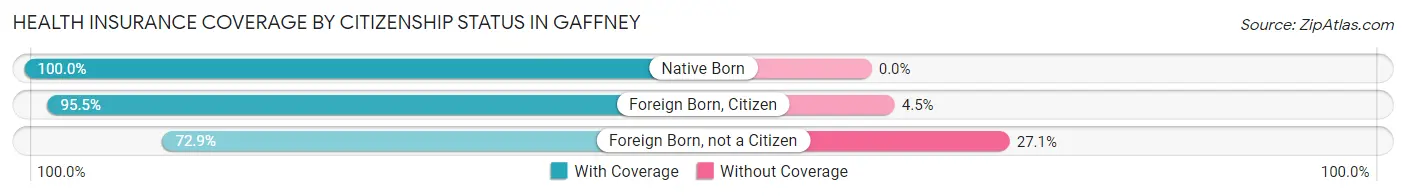
| Citizenship Status | With Coverage | Without Coverage |
| Native Born | 1,149 (100.0%) | 0 (0.0%) |
| Foreign Born, Citizen | 1,772 (95.5%) | 84 (4.5%) |
| Foreign Born, not a Citizen | 1,188 (72.9%) | 442 (27.1%) |
Health Insurance Coverage by Household Income in Gaffney
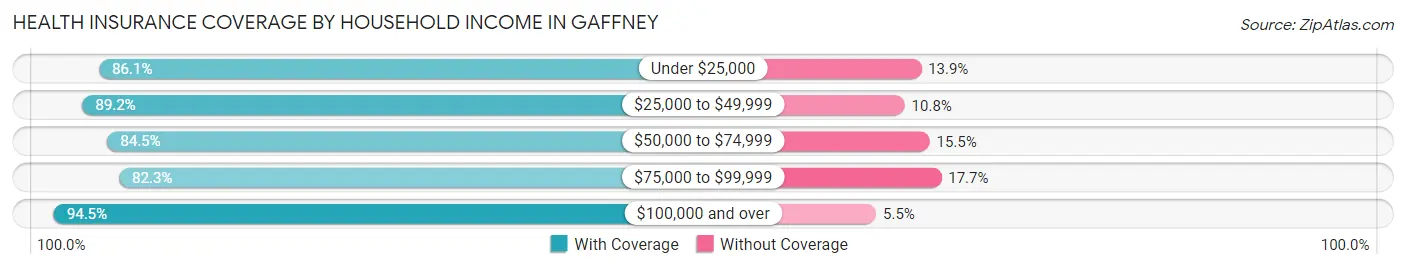
| Household Income | With Coverage | Without Coverage |
| Under $25,000 | 2,018 (86.1%) | 327 (13.9%) |
| $25,000 to $49,999 | 3,637 (89.2%) | 442 (10.8%) |
| $50,000 to $74,999 | 1,602 (84.5%) | 294 (15.5%) |
| $75,000 to $99,999 | 1,008 (82.3%) | 217 (17.7%) |
| $100,000 and over | 1,979 (94.5%) | 115 (5.5%) |
Public vs Private Health Insurance Coverage by Age in Gaffney
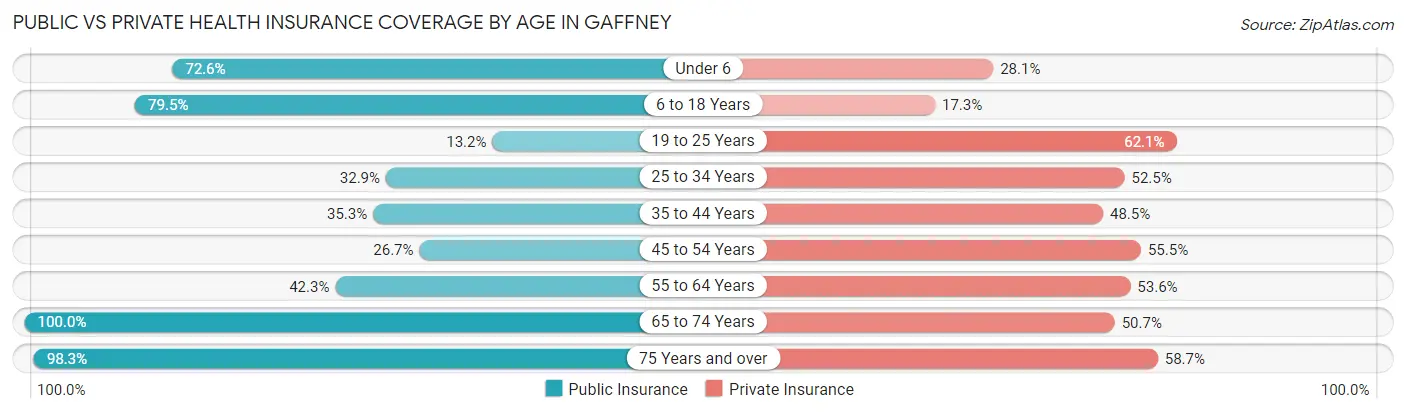
| Age Bracket | Public Insurance | Private Insurance |
| Under 6 | 834 (72.6%) | 323 (28.1%) |
| 6 to 18 Years | 1,475 (79.5%) | 321 (17.3%) |
| 19 to 25 Years | 215 (13.2%) | 1,012 (62.1%) |
| 25 to 34 Years | 588 (32.9%) | 937 (52.5%) |
| 35 to 44 Years | 480 (35.3%) | 659 (48.5%) |
| 45 to 54 Years | 360 (26.7%) | 748 (55.5%) |
| 55 to 64 Years | 539 (42.3%) | 682 (53.6%) |
| 65 to 74 Years | 1,058 (100.0%) | 536 (50.7%) |
| 75 Years and over | 744 (98.3%) | 444 (58.7%) |
| Total | 6,293 (51.5%) | 5,662 (46.4%) |
Disability Status by Sex by Age in Gaffney
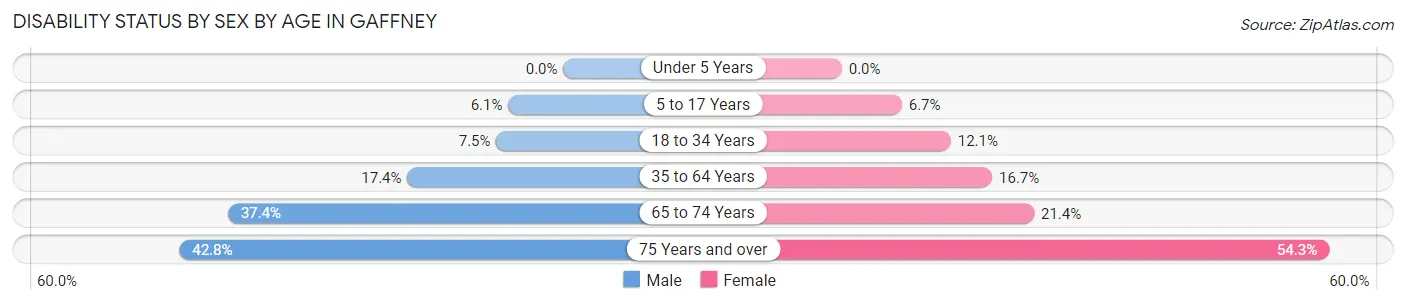
| Age Bracket | Male | Female |
| Under 5 Years | 0 (0.0%) | 0 (0.0%) |
| 5 to 17 Years | 51 (6.1%) | 63 (6.7%) |
| 18 to 34 Years | 146 (7.5%) | 213 (12.1%) |
| 35 to 64 Years | 302 (17.4%) | 375 (16.7%) |
| 65 to 74 Years | 200 (37.4%) | 112 (21.4%) |
| 75 Years and over | 133 (42.8%) | 242 (54.3%) |
Disability Class by Sex by Age in Gaffney
Disability Class: Hearing Difficulty
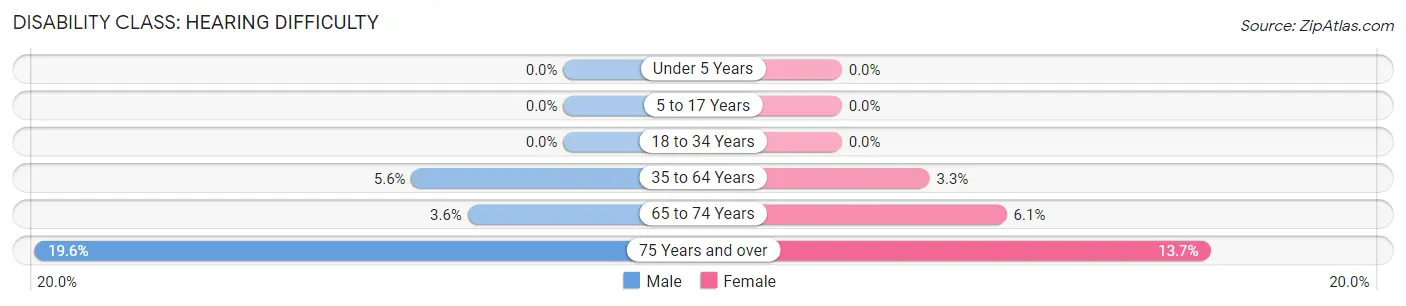
| Age Bracket | Male | Female |
| Under 5 Years | 0 (0.0%) | 0 (0.0%) |
| 5 to 17 Years | 0 (0.0%) | 0 (0.0%) |
| 18 to 34 Years | 0 (0.0%) | 0 (0.0%) |
| 35 to 64 Years | 98 (5.6%) | 73 (3.3%) |
| 65 to 74 Years | 19 (3.5%) | 32 (6.1%) |
| 75 Years and over | 61 (19.6%) | 61 (13.7%) |
Disability Class: Vision Difficulty
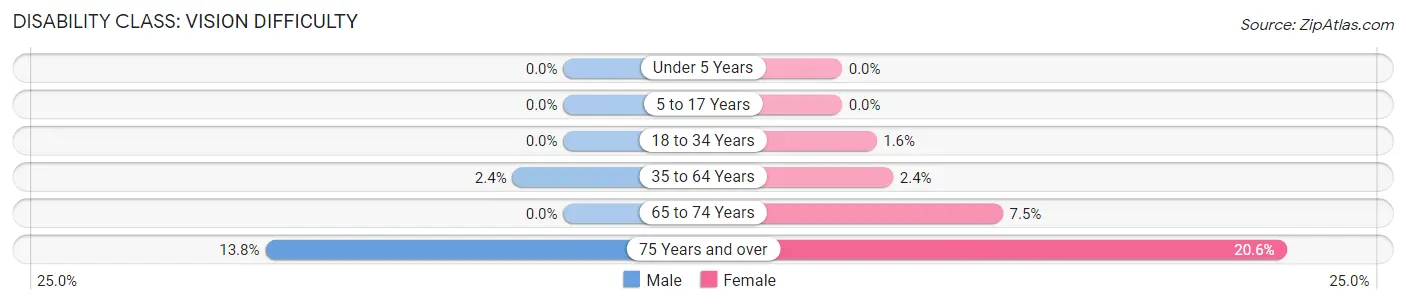
| Age Bracket | Male | Female |
| Under 5 Years | 0 (0.0%) | 0 (0.0%) |
| 5 to 17 Years | 0 (0.0%) | 0 (0.0%) |
| 18 to 34 Years | 0 (0.0%) | 28 (1.6%) |
| 35 to 64 Years | 41 (2.4%) | 53 (2.4%) |
| 65 to 74 Years | 0 (0.0%) | 39 (7.5%) |
| 75 Years and over | 43 (13.8%) | 92 (20.6%) |
Disability Class: Cognitive Difficulty
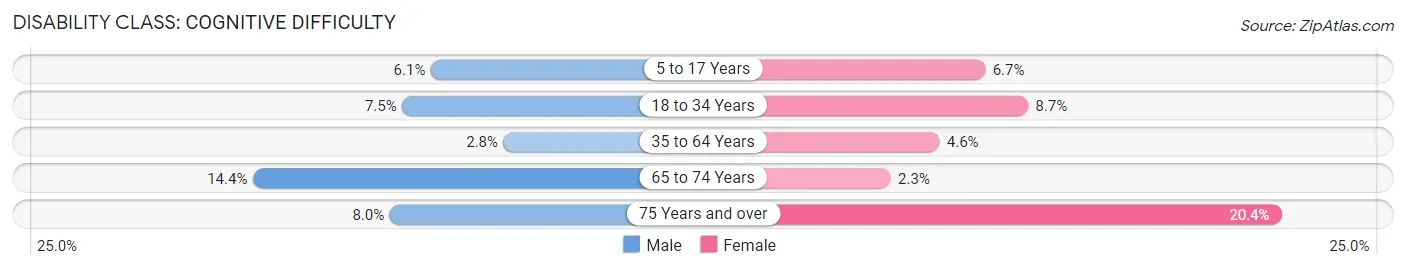
| Age Bracket | Male | Female |
| 5 to 17 Years | 51 (6.1%) | 63 (6.7%) |
| 18 to 34 Years | 146 (7.5%) | 152 (8.7%) |
| 35 to 64 Years | 48 (2.8%) | 102 (4.5%) |
| 65 to 74 Years | 77 (14.4%) | 12 (2.3%) |
| 75 Years and over | 25 (8.0%) | 91 (20.4%) |
Disability Class: Ambulatory Difficulty
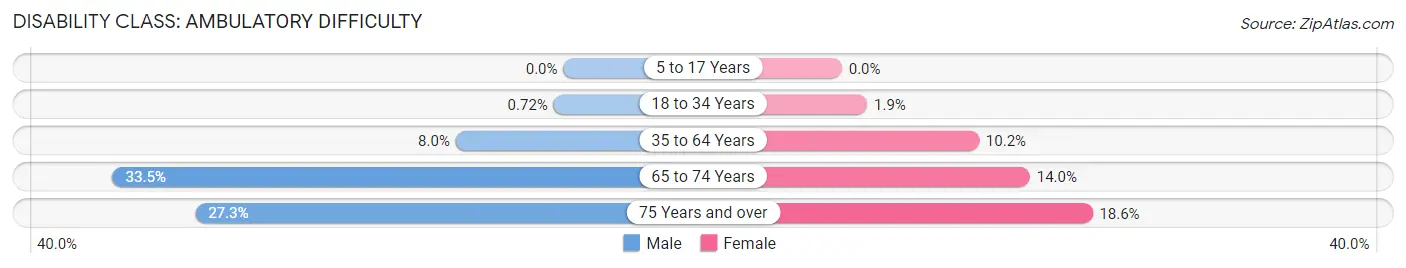
| Age Bracket | Male | Female |
| 5 to 17 Years | 0 (0.0%) | 0 (0.0%) |
| 18 to 34 Years | 14 (0.7%) | 33 (1.9%) |
| 35 to 64 Years | 139 (8.0%) | 228 (10.2%) |
| 65 to 74 Years | 179 (33.5%) | 73 (14.0%) |
| 75 Years and over | 85 (27.3%) | 83 (18.6%) |
Disability Class: Self-Care Difficulty
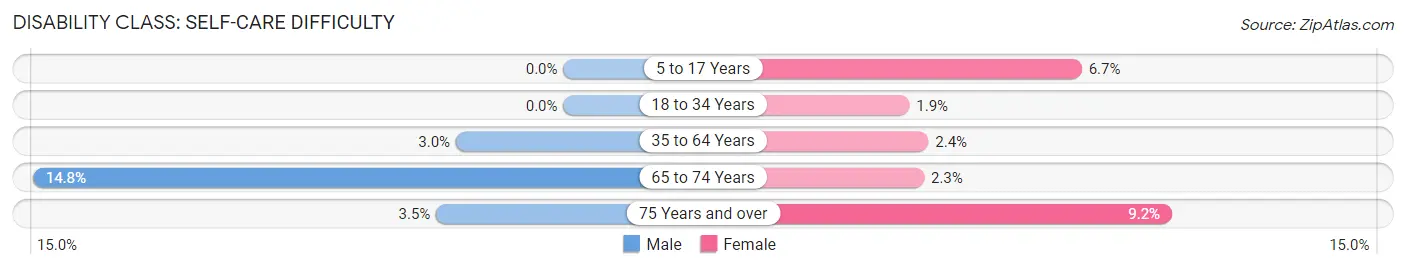
| Age Bracket | Male | Female |
| 5 to 17 Years | 0 (0.0%) | 63 (6.7%) |
| 18 to 34 Years | 0 (0.0%) | 33 (1.9%) |
| 35 to 64 Years | 52 (3.0%) | 54 (2.4%) |
| 65 to 74 Years | 79 (14.8%) | 12 (2.3%) |
| 75 Years and over | 11 (3.5%) | 41 (9.2%) |
Technology Access in Gaffney
Computing Device Access in Gaffney
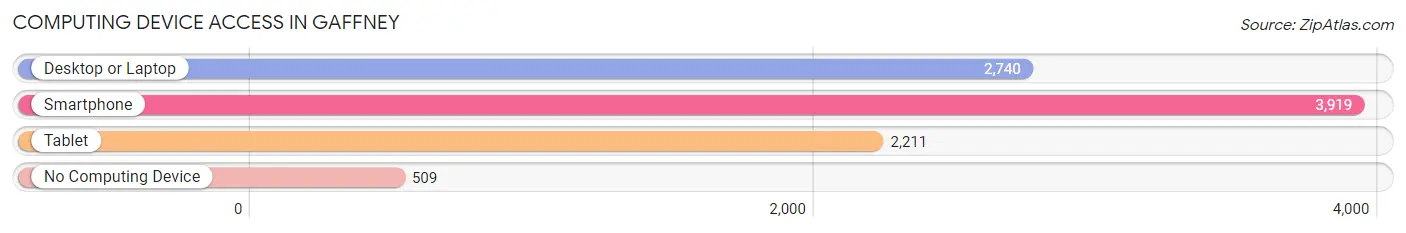
| Device Type | # Households | % Households |
| Desktop or Laptop | 2,740 | 59.4% |
| Smartphone | 3,919 | 85.0% |
| Tablet | 2,211 | 47.9% |
| No Computing Device | 509 | 11.0% |
| Total | 4,611 | 100.0% |
Internet Access in Gaffney
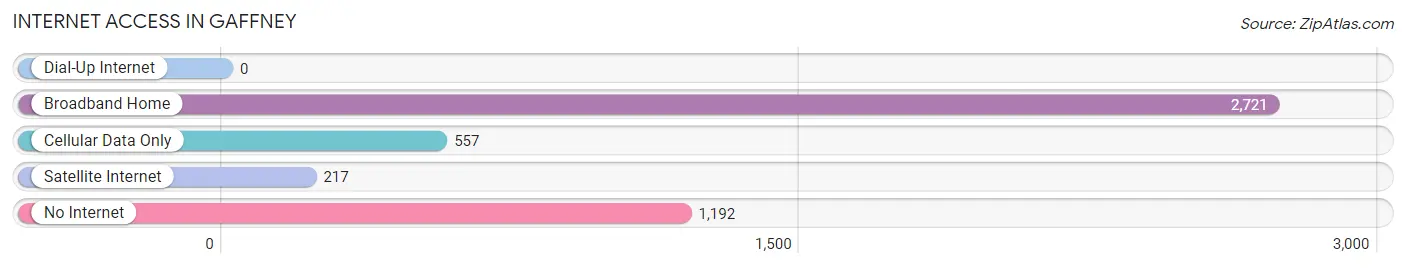
| Internet Type | # Households | % Households |
| Dial-Up Internet | 0 | 0.0% |
| Broadband Home | 2,721 | 59.0% |
| Cellular Data Only | 557 | 12.1% |
| Satellite Internet | 217 | 4.7% |
| No Internet | 1,192 | 25.9% |
| Total | 4,611 | 100.0% |
Gaffney Summary
Gaffney, South Carolina is a small city located in Cherokee County in the Upstate region of the state. It is situated along the I-85 corridor, approximately halfway between Charlotte, North Carolina and Atlanta, Georgia. The city is known for its peach-shaped water tower, which is a popular tourist attraction.
History
Gaffney was founded in 1848 by Michael Gaffney, a Revolutionary War veteran. The city was named after him and was incorporated in 1872. Gaffney was a major railroad hub in the late 19th and early 20th centuries, and the city was home to several cotton mills. The city was also the site of a major Civil War battle in 1865.
Geography
Gaffney is located in the foothills of the Blue Ridge Mountains, and the city is situated along the I-85 corridor. The city has a total area of 8.3 square miles, and the elevation is 845 feet. The city is located in the Piedmont region of South Carolina, and the climate is characterized by hot, humid summers and mild winters.
Economy
Gaffney’s economy is largely based on manufacturing and agriculture. The city is home to several large manufacturing plants, including a textile mill, a furniture factory, and a plastics plant. The city is also home to several agricultural operations, including peach and apple orchards, as well as dairy and poultry farms.
Demographics
As of the 2010 census, Gaffney had a population of 12,539. The racial makeup of the city was 68.3% White, 28.2% African American, 0.4% Native American, 0.7% Asian, 0.1% Pacific Islander, and 1.3% from other races. The median household income was $30,945, and the median family income was $37,941.
Gaffney is a small city with a rich history and a diverse economy. The city is home to several manufacturing and agricultural operations, and the population is diverse. Gaffney is a great place to live, work, and visit, and it is a great example of the beauty and culture of the Upstate region of South Carolina.
Common Questions
What is Per Capita Income in Gaffney?
Per Capita income in Gaffney is $21,682.
What is the Median Family Income in Gaffney?
Median Family Income in Gaffney is $51,333.
What is the Median Household income in Gaffney?
Median Household Income in Gaffney is $38,059.
What is Income or Wage Gap in Gaffney?
Income or Wage Gap in Gaffney is 29.6%.
Women in Gaffney earn 70.4 cents for every dollar earned by a man.
What is Inequality or Gini Index in Gaffney?
Inequality or Gini Index in Gaffney is 0.48.
What is the Total Population of Gaffney?
Total Population of Gaffney is 12,651.
What is the Total Male Population of Gaffney?
Total Male Population of Gaffney is 6,081.
What is the Total Female Population of Gaffney?
Total Female Population of Gaffney is 6,570.
What is the Ratio of Males per 100 Females in Gaffney?
There are 92.56 Males per 100 Females in Gaffney.
What is the Ratio of Females per 100 Males in Gaffney?
There are 108.04 Females per 100 Males in Gaffney.
What is the Median Population Age in Gaffney?
Median Population Age in Gaffney is 33.6 Years.
What is the Average Family Size in Gaffney
Average Family Size in Gaffney is 3.5 People.
What is the Average Household Size in Gaffney
Average Household Size in Gaffney is 2.5 People.
How Large is the Labor Force in Gaffney?
There are 5,504 People in the Labor Forcein in Gaffney.
What is the Percentage of People in the Labor Force in Gaffney?
54.6% of People are in the Labor Force in Gaffney.
What is the Unemployment Rate in Gaffney?
Unemployment Rate in Gaffney is 9.4%.