Zip Codes with the Highest Percentage of Population Employed in Computer & Mathematics in Reading, PA
RELATED REPORTS & OPTIONS
Computer & Mathematics
Reading
Compare Zip Codes
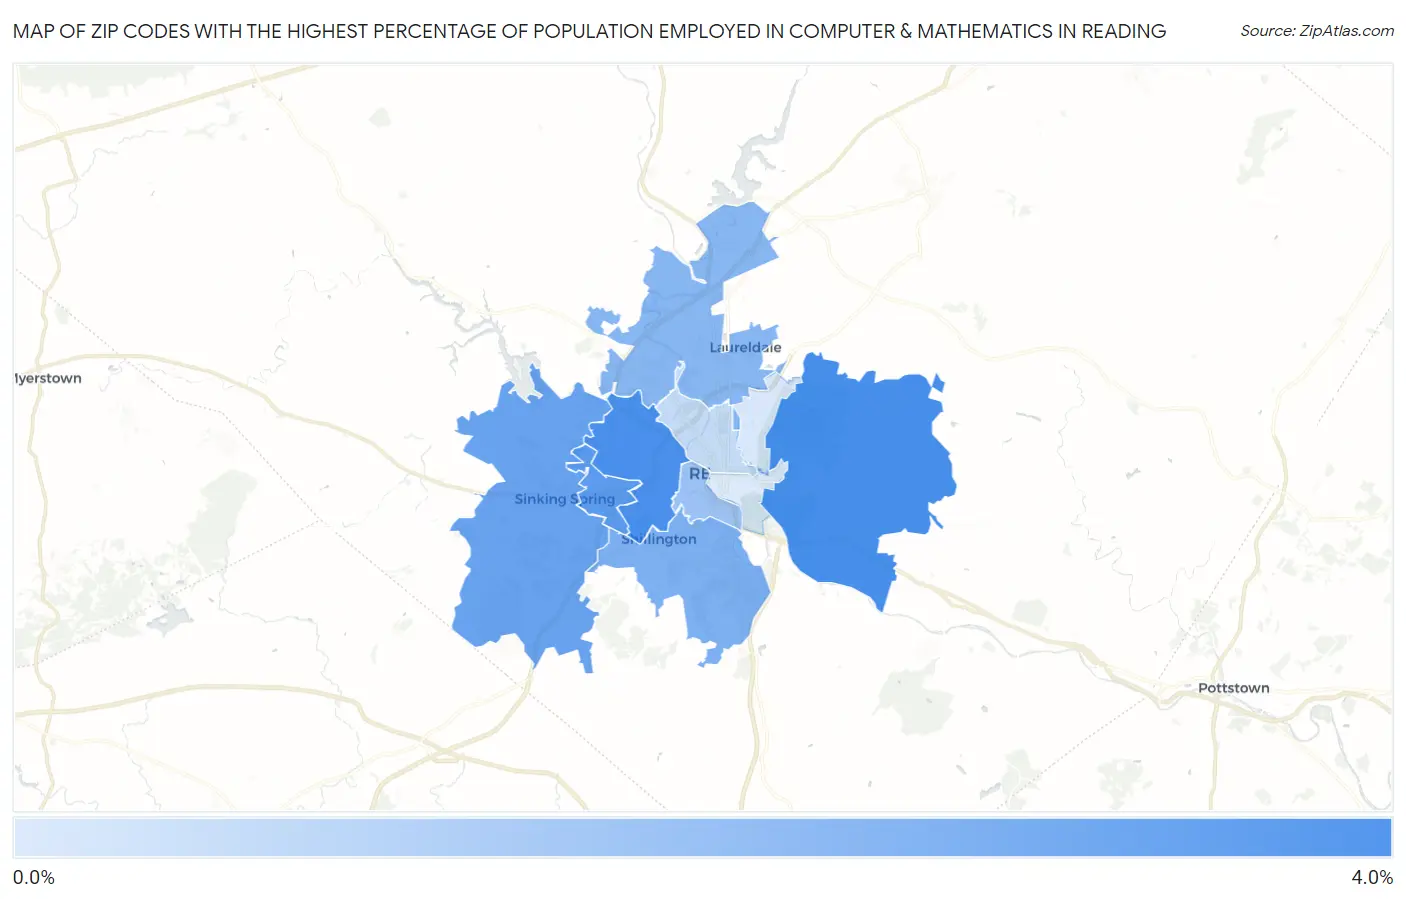
Map of Zip Codes with the Highest Percentage of Population Employed in Computer & Mathematics in Reading
0.37%
3.2%
Zip Codes with the Highest Percentage of Population Employed in Computer & Mathematics in Reading, PA
| Zip Code | % Employed | vs State | vs National | |
| 1. | 19606 | 3.2% | 3.3%(-0.104)#397 | 3.5%(-0.352)#7,188 |
| 2. | 19610 | 3.1% | 3.3%(-0.127)#404 | 3.5%(-0.375)#7,267 |
| 3. | 19609 | 2.8% | 3.3%(-0.487)#470 | 3.5%(-0.736)#8,495 |
| 4. | 19608 | 2.6% | 3.3%(-0.720)#523 | 3.5%(-0.968)#9,399 |
| 5. | 19607 | 2.2% | 3.3%(-1.09)#608 | 3.5%(-1.34)#10,951 |
| 6. | 19605 | 1.9% | 3.3%(-1.34)#668 | 3.5%(-1.58)#12,096 |
| 7. | 19611 | 1.6% | 3.3%(-1.72)#764 | 3.5%(-1.97)#14,050 |
| 8. | 19601 | 0.85% | 3.3%(-2.43)#1,021 | 3.5%(-2.68)#18,347 |
| 9. | 19604 | 0.44% | 3.3%(-2.83)#1,153 | 3.5%(-3.08)#20,837 |
| 10. | 19602 | 0.37% | 3.3%(-2.90)#1,175 | 3.5%(-3.15)#21,211 |
1
Common Questions
What are the Top 5 Zip Codes with the Highest Percentage of Population Employed in Computer & Mathematics in Reading, PA?
Top 5 Zip Codes with the Highest Percentage of Population Employed in Computer & Mathematics in Reading, PA are:
What zip code has the Highest Percentage of Population Employed in Computer & Mathematics in Reading, PA?
19606 has the Highest Percentage of Population Employed in Computer & Mathematics in Reading, PA with 3.2%.
What is the Percentage of Population Employed in Computer & Mathematics in Reading, PA?
Percentage of Population Employed in Computer & Mathematics in Reading is 0.74%.
What is the Percentage of Population Employed in Computer & Mathematics in Pennsylvania?
Percentage of Population Employed in Computer & Mathematics in Pennsylvania is 3.3%.
What is the Percentage of Population Employed in Computer & Mathematics in the United States?
Percentage of Population Employed in Computer & Mathematics in the United States is 3.5%.