Zip Codes with the Highest Percentage of Immigrants from Latin America in Reading, PA
RELATED REPORTS & OPTIONS
Latin America
Reading
Compare Zip Codes
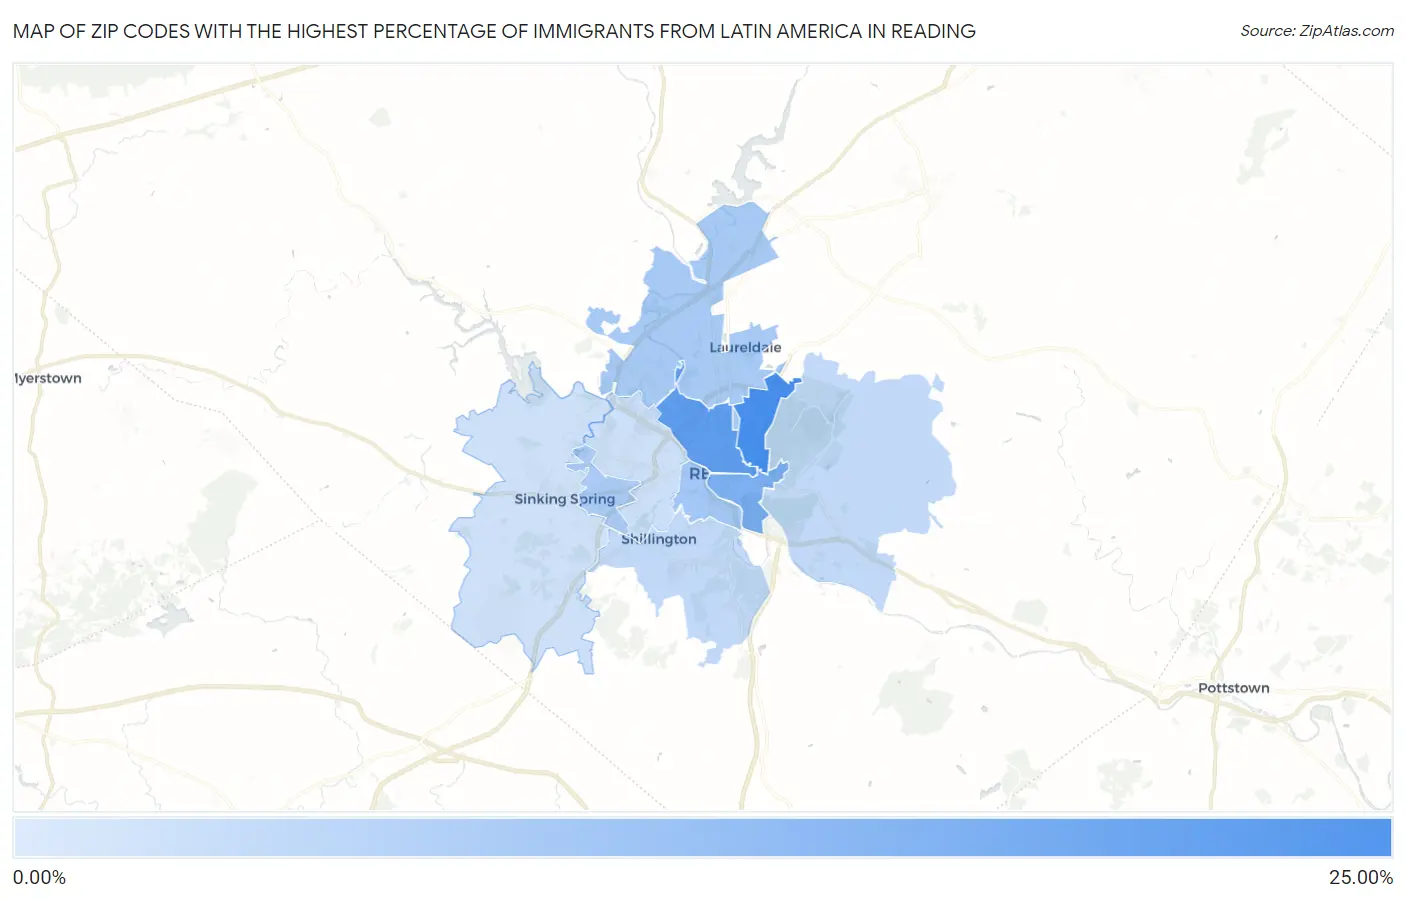
Map of Zip Codes with the Highest Percentage of Immigrants from Latin America in Reading
1.95%
22.18%
Zip Codes with the Highest Percentage of Immigrants from Latin America in Reading, PA
| Zip Code | Latin America | vs State | vs National | |
| 1. | 19604 | 22.18% | 2.31%(+19.9)#-1 | 6.84%(+15.3)#0 |
| 2. | 19601 | 18.52% | 2.31%(+16.2)#156 | 6.84%(+11.7)#4,948 |
| 3. | 19602 | 13.82% | 2.31%(+11.5)#157 | 6.84%(+6.98)#4,949 |
| 4. | 19611 | 8.07% | 2.31%(+5.75)#158 | 6.84%(+1.23)#4,950 |
| 5. | 19605 | 7.24% | 2.31%(+4.92)#159 | 6.84%(+0.395)#4,951 |
| 6. | 19609 | 6.89% | 2.31%(+4.57)#160 | 6.84%(+0.044)#4,952 |
| 7. | 19607 | 3.70% | 2.31%(+1.39)#161 | 6.84%(-3.14)#4,953 |
| 8. | 19606 | 3.69% | 2.31%(+1.38)#162 | 6.84%(-3.15)#4,954 |
| 9. | 19610 | 2.15% | 2.31%(-0.162)#163 | 6.84%(-4.69)#4,955 |
| 10. | 19608 | 1.95% | 2.31%(-0.368)#164 | 6.84%(-4.89)#4,956 |
1
Common Questions
What are the Top 5 Zip Codes with the Highest Percentage of Immigrants from Latin America in Reading, PA?
Top 5 Zip Codes with the Highest Percentage of Immigrants from Latin America in Reading, PA are:
What zip code has the Highest Percentage of Immigrants from Latin America in Reading, PA?
19604 has the Highest Percentage of Immigrants from Latin America in Reading, PA with 22.18%.
What is the Percentage of Immigrants from Latin America in Reading, PA?
Percentage of Immigrants from Latin America in Reading is 17.79%.
What is the Percentage of Immigrants from Latin America in Pennsylvania?
Percentage of Immigrants from Latin America in Pennsylvania is 2.31%.
What is the Percentage of Immigrants from Latin America in the United States?
Percentage of Immigrants from Latin America in the United States is 6.84%.