Zip Codes with the Highest Percentage of Population Employed in Legal Services & Support in Reading, PA
RELATED REPORTS & OPTIONS
Legal Services & Support
Reading
Compare Zip Codes
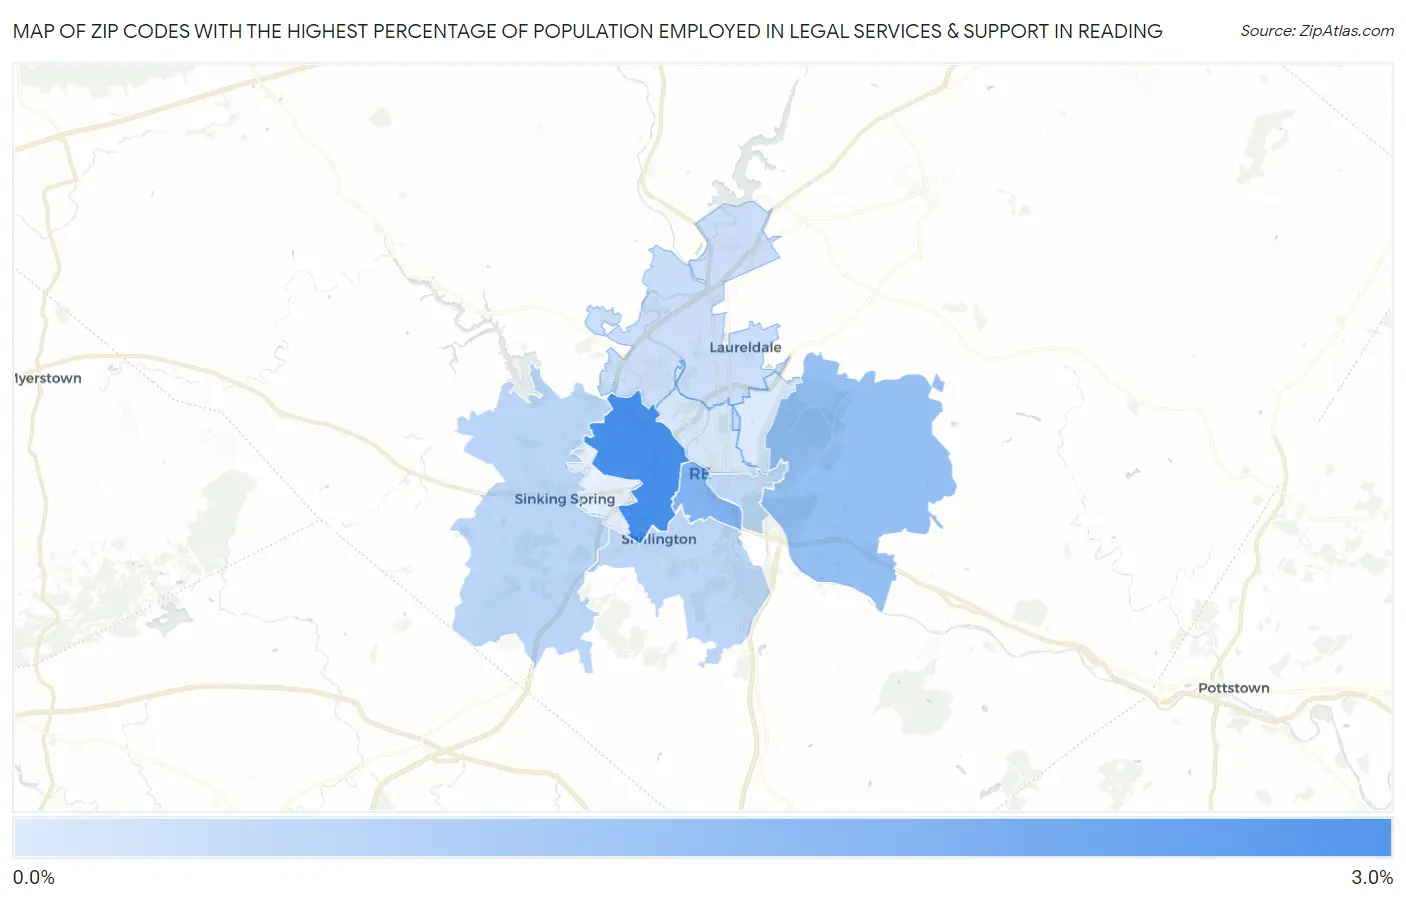
Map of Zip Codes with the Highest Percentage of Population Employed in Legal Services & Support in Reading
0.037%
2.6%
Zip Codes with the Highest Percentage of Population Employed in Legal Services & Support in Reading, PA
| Zip Code | % Employed | vs State | vs National | |
| 1. | 19610 | 2.6% | 1.1%(+1.48)#105 | 1.2%(+1.44)#2,304 |
| 2. | 19611 | 1.6% | 1.1%(+0.491)#202 | 1.2%(+0.454)#4,531 |
| 3. | 19606 | 1.3% | 1.1%(+0.127)#269 | 1.2%(+0.091)#6,073 |
| 4. | 19608 | 0.61% | 1.1%(-0.536)#545 | 1.2%(-0.572)#11,342 |
| 5. | 19607 | 0.60% | 1.1%(-0.546)#553 | 1.2%(-0.582)#11,446 |
| 6. | 19602 | 0.55% | 1.1%(-0.595)#589 | 1.2%(-0.632)#12,034 |
| 7. | 19605 | 0.37% | 1.1%(-0.776)#710 | 1.2%(-0.813)#14,186 |
| 8. | 19601 | 0.16% | 1.1%(-0.985)#847 | 1.2%(-1.02)#16,569 |
| 9. | 19604 | 0.037% | 1.1%(-1.11)#902 | 1.2%(-1.15)#17,465 |
1
Common Questions
What are the Top 5 Zip Codes with the Highest Percentage of Population Employed in Legal Services & Support in Reading, PA?
Top 5 Zip Codes with the Highest Percentage of Population Employed in Legal Services & Support in Reading, PA are:
What zip code has the Highest Percentage of Population Employed in Legal Services & Support in Reading, PA?
19610 has the Highest Percentage of Population Employed in Legal Services & Support in Reading, PA with 2.6%.
What is the Percentage of Population Employed in Legal Services & Support in Reading, PA?
Percentage of Population Employed in Legal Services & Support in Reading is 0.23%.
What is the Percentage of Population Employed in Legal Services & Support in Pennsylvania?
Percentage of Population Employed in Legal Services & Support in Pennsylvania is 1.1%.
What is the Percentage of Population Employed in Legal Services & Support in the United States?
Percentage of Population Employed in Legal Services & Support in the United States is 1.2%.