Zip Codes with the Highest Percentage of Population with a Degree in Social Sciences in Reading, PA
RELATED REPORTS & OPTIONS
Social Sciences
Reading
Compare Zip Codes
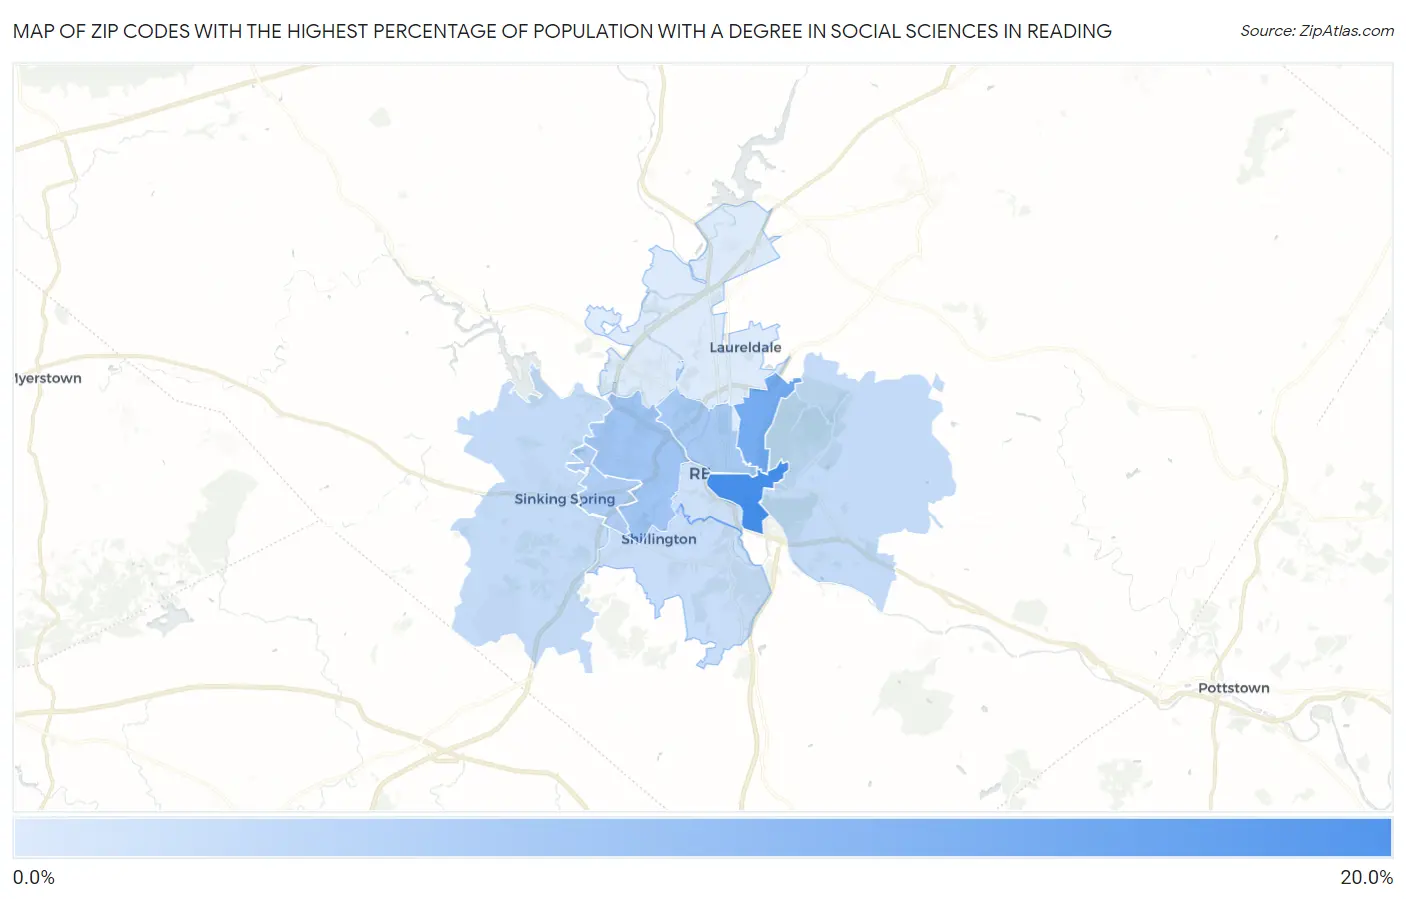
Map of Zip Codes with the Highest Percentage of Population with a Degree in Social Sciences in Reading
3.1%
16.5%
Zip Codes with the Highest Percentage of Population with a Degree in Social Sciences in Reading, PA
| Zip Code | % Graduates | vs State | vs National | |
| 1. | 19602 | 16.5% | 7.2%(+9.37)#94 | 8.1%(+8.47)#1,494 |
| 2. | 19604 | 12.2% | 7.2%(+5.03)#166 | 8.1%(+4.13)#3,350 |
| 3. | 19610 | 8.3% | 7.2%(+1.16)#384 | 8.1%(+0.252)#8,143 |
| 4. | 19601 | 7.7% | 7.2%(+0.503)#445 | 8.1%(-0.402)#9,439 |
| 5. | 19609 | 7.1% | 7.2%(-0.068)#505 | 8.1%(-0.973)#10,694 |
| 6. | 19608 | 5.3% | 7.2%(-1.82)#778 | 8.1%(-2.72)#14,967 |
| 7. | 19606 | 5.2% | 7.2%(-1.93)#799 | 8.1%(-2.84)#15,266 |
| 8. | 19607 | 4.8% | 7.2%(-2.36)#868 | 8.1%(-3.26)#16,267 |
| 9. | 19611 | 4.4% | 7.2%(-2.78)#941 | 8.1%(-3.69)#17,301 |
| 10. | 19605 | 3.1% | 7.2%(-4.05)#1,097 | 8.1%(-4.95)#20,112 |
1
Common Questions
What are the Top 5 Zip Codes with the Highest Percentage of Population with a Degree in Social Sciences in Reading, PA?
Top 5 Zip Codes with the Highest Percentage of Population with a Degree in Social Sciences in Reading, PA are:
What zip code has the Highest Percentage of Population with a Degree in Social Sciences in Reading, PA?
19602 has the Highest Percentage of Population with a Degree in Social Sciences in Reading, PA with 16.5%.
What is the Percentage of Population with a Degree in Social Sciences in Reading, PA?
Percentage of Population with a Degree in Social Sciences in Reading is 9.5%.
What is the Percentage of Population with a Degree in Social Sciences in Pennsylvania?
Percentage of Population with a Degree in Social Sciences in Pennsylvania is 7.2%.
What is the Percentage of Population with a Degree in Social Sciences in the United States?
Percentage of Population with a Degree in Social Sciences in the United States is 8.1%.