Zip Codes with the Highest Percentage of Households Without a Vehicle in Reading, PA
RELATED REPORTS & OPTIONS
Households without a Cars
Reading
Compare Zip Codes
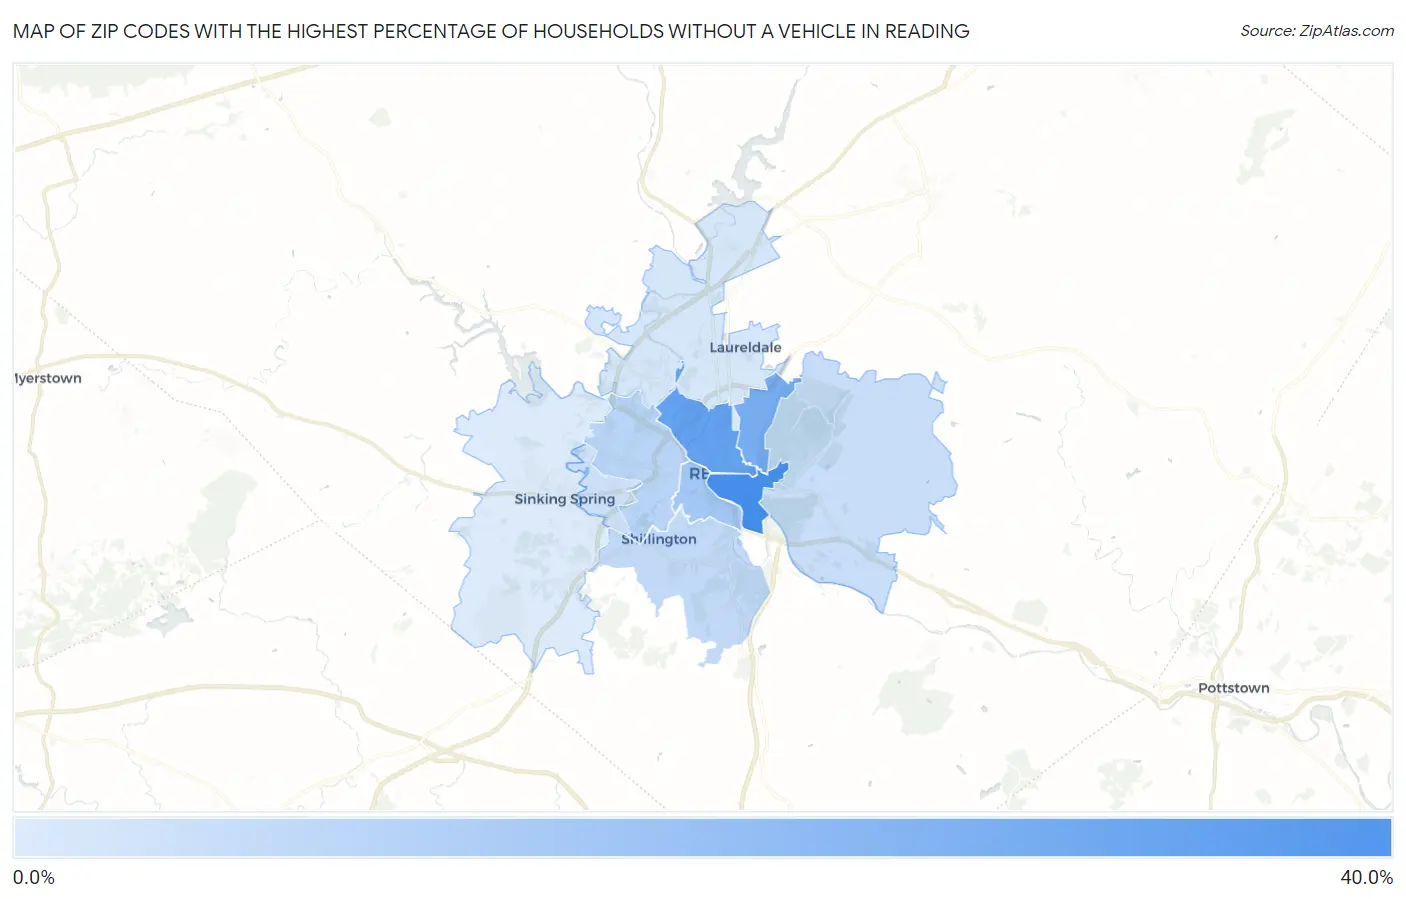
Map of Zip Codes with the Highest Percentage of Households Without a Vehicle in Reading
2.3%
31.5%
Zip Codes with the Highest Percentage of Households Without a Vehicle in Reading, PA
| Zip Code | Housholds Without a Car | vs State | vs National | |
| 1. | 19602 | 31.5% | 10.6%(+20.9)#52 | 8.3%(+23.2)#747 |
| 2. | 19601 | 25.6% | 10.6%(+15.0)#84 | 8.3%(+17.3)#1,027 |
| 3. | 19604 | 21.3% | 10.6%(+10.7)#116 | 8.3%(+13.0)#1,354 |
| 4. | 19611 | 12.6% | 10.6%(+2.00)#263 | 8.3%(+4.30)#3,285 |
| 5. | 19610 | 8.2% | 10.6%(-2.40)#496 | 8.3%(-0.100)#6,670 |
| 6. | 19607 | 7.1% | 10.6%(-3.50)#607 | 8.3%(-1.20)#8,387 |
| 7. | 19606 | 6.1% | 10.6%(-4.50)#719 | 8.3%(-2.20)#10,186 |
| 8. | 19609 | 4.9% | 10.6%(-5.70)#884 | 8.3%(-3.40)#13,162 |
| 9. | 19605 | 3.5% | 10.6%(-7.10)#1,105 | 8.3%(-4.80)#17,358 |
| 10. | 19608 | 2.3% | 10.6%(-8.30)#1,287 | 8.3%(-6.00)#21,395 |
1
Common Questions
What are the Top 5 Zip Codes with the Highest Percentage of Households Without a Vehicle in Reading, PA?
Top 5 Zip Codes with the Highest Percentage of Households Without a Vehicle in Reading, PA are:
What zip code has the Highest Percentage of Households Without a Vehicle in Reading, PA?
19602 has the Highest Percentage of Households Without a Vehicle in Reading, PA with 31.5%.
What is the Percentage of Households Without a Vehicle in Reading, PA?
Percentage of Households Without a Vehicle in Reading is 24.8%.
What is the Percentage of Households Without a Vehicle in Pennsylvania?
Percentage of Households Without a Vehicle in Pennsylvania is 10.6%.
What is the Percentage of Households Without a Vehicle in the United States?
Percentage of Households Without a Vehicle in the United States is 8.3%.